3JD · Interactive Sprint Timer
Proyecto: 3JD_01_Jersey-Mikes-Roadshow-Video_GFX (Propuesta Hoy)
Cargando...
Descripción...
📊 STATUS
📋 BRIEF
.aep).
Fechas Límite Clave
- Primeros Borradores (GFX 7, 10, 15): Martes 30 de Junio (EOD)
- Siguientes Borradores (GFX 17, 18, 19, 21): Jueves 2 de Julio (EOD)
- Primer Corte Integrado (V1 Cut): Martes 7 de Julio (EOD)
- Entrega Final Aprobada: Viernes 17 de Julio
Links y Recursos Compartidos
👥 EQUIPO
💬 Log de Comunicaciones Recientes
Diccionario de términos y acrónimos financieros utilizados en la locución y en las presentaciones de inversión de Jersey Mike's.
Tasa promedio anual a la que crece una métrica en un período de varios años, asumiendo que el crecimiento se acumula cada año. Estándar contable para suavizar fluctuaciones anuales.
La utilidad pura que genera la operación del negocio. Mide la potencia de la "maquinaria comercial" antes de restarle impuestos contables y costos de financiamiento.
Ventas promedio que genera una sola tienda de Jersey Mike's en un año (actualmente $1.4M). Clave para demostrar el valor comercial de una franquicia.
La suma de las ventas de todas las tiendas de la marca (franquicias + corporativas). Muestra la escala e impacto de la marca, no confundir con ingresos corporativos directos.
El dinero real facturado por la corporación Jersey Mike's (fees de franquicias, cobros de cadena de suministro y sistemas), no la venta directa de los sándwiches.
El dinero en efectivo disponible y retirable que le queda a la empresa tras cubrir todos los gastos operativos e inversiones de mantenimiento (CapEx).
Dinero invertido en adquirir o mejorar activos fijos (tecnología, cocinas, oficinas). Al estar franquiciados, el CapEx de la matriz de Jersey Mike's es extremadamente bajo.
Crecimiento de ventas considerando únicamente las sucursales que ya llevan abiertas más de 14 meses. Muestra si las tiendas existentes siguen atrayendo clientes.
Ganancias operativas de la empresa ajustadas para eliminar costos extraordinarios o no recurrentes que no corresponden a la operación habitual (como gastos de transición del fundador, uso del jet privado o costos del IPO de Blackstone). Es la métrica usada para medir el desempeño en la tabla a 3 años.
EBITDA sujeto a definiciones de contratos de crédito o cálculos de margen estandarizados de la industria. Se utiliza para calcular el "Adjusted EBITDA Margin" (que para Jersey Mike's es del 47%) e incluye ajustes de capitalizaciones, regalías diferidas y gastos compartidos.
La oportunidad de mercado global máxima estimada para un producto o servicio (ej. Jersey Mike's proyecta un TAM de más de 15,000 tiendas totales a largo plazo).
Promociones u opciones de menú disponibles por tiempo limitado (ej. combo Boardwalk, Hot Italian sub) diseñadas para atraer nuevos usuarios y picos de tráfico.
Tablas de datos optimizadas para copiar y pegar en After Effects, build-ups dinámicos e indicaciones visuales para las animaciones.
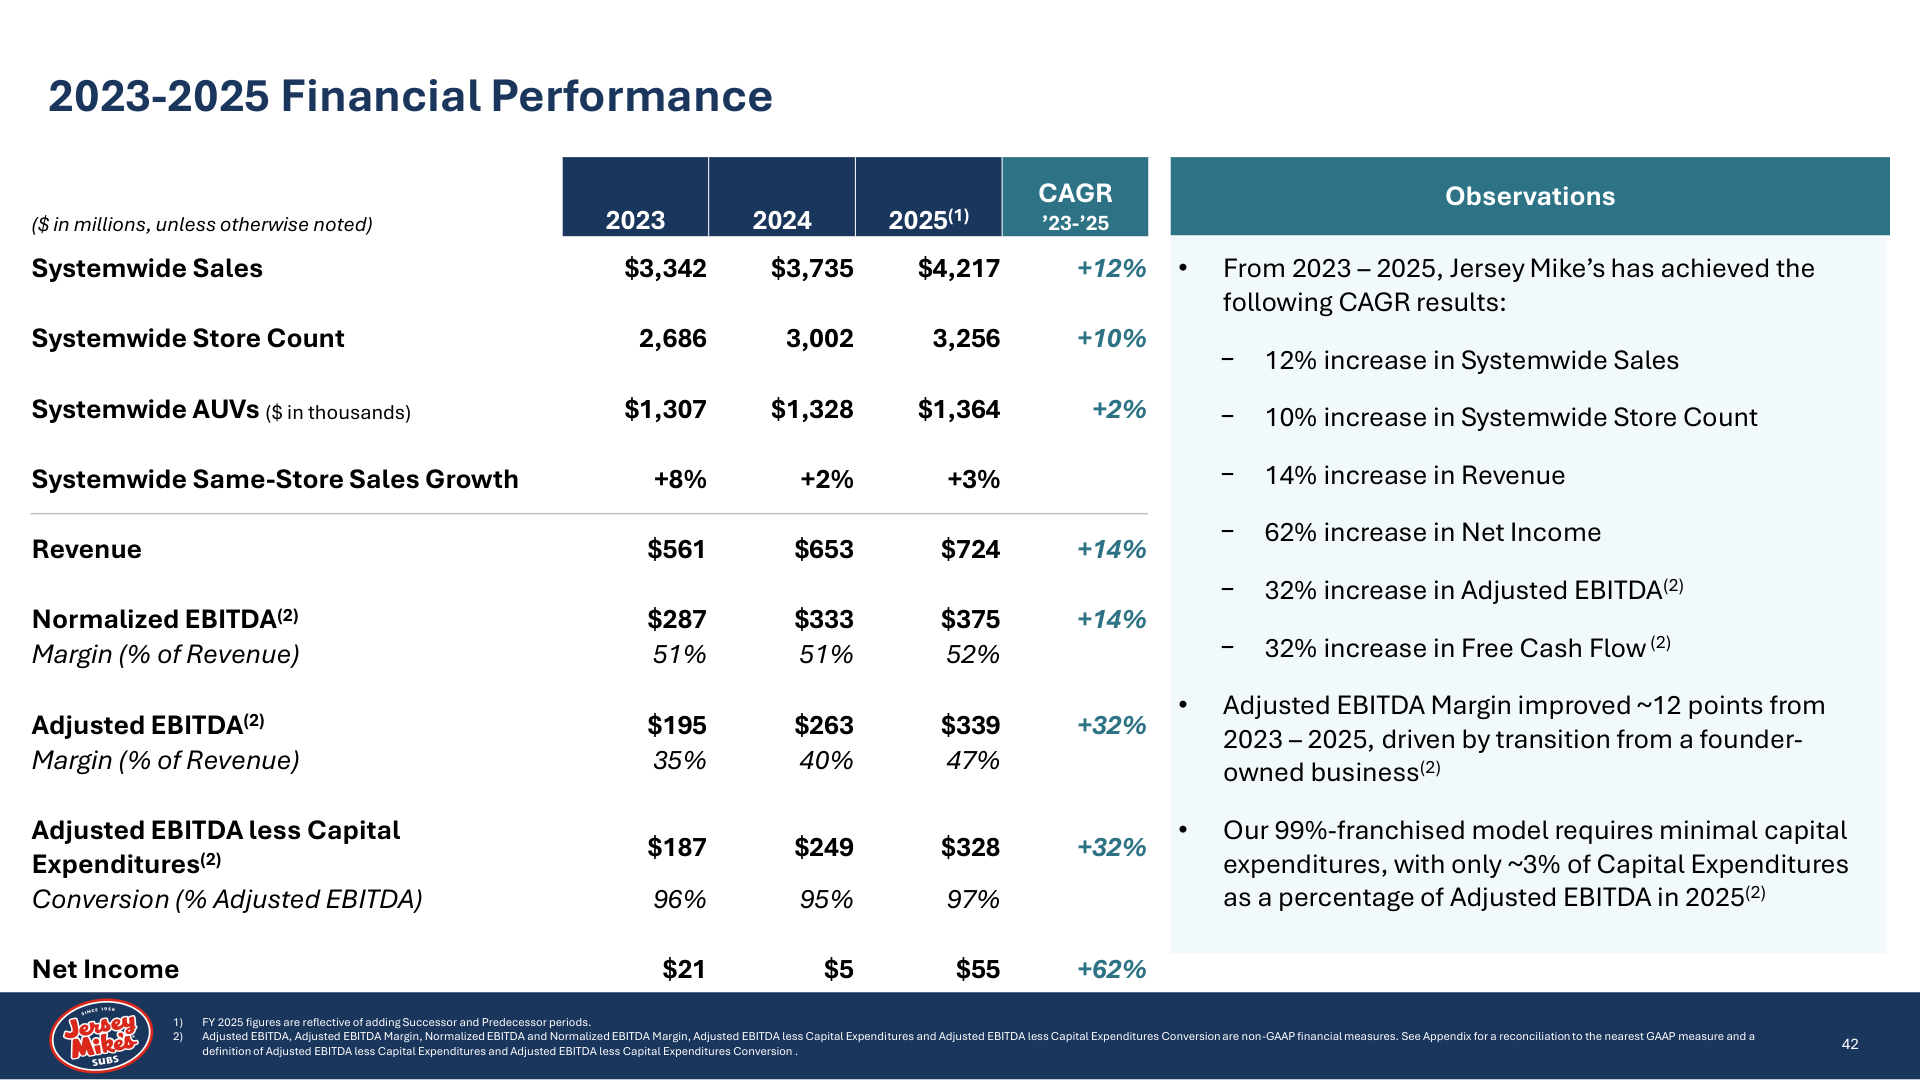
📊 Tabla de Datos para After Effects (GFX 19 — Slide 42) 3-Year Financials Reference
| Métrica / Renglón | 2023 (Dato Inicial) | 2024 (Extra) | 2025 (Dato Final) | CAGR (Extra) | 🎙️ Highlight de Locución |
|---|---|---|---|---|---|
| 1. Systemwide Sales | $3,342M | $3,735M | $4,217M | +12% | +26% Grew from ~$3.3B to over $4.2B, up 26% |
| 2. Store Count | 2,686 | 3,002 | 3,256 | +10% | +21% Rose 21% to 3,256 locations |
| 3. Systemwide AUVs | $1,307K | $1,328K | $1,364K | +2% | AUVs expanded to $1.36 Million |
| 4. Same-Store Sales Growth | +8% | +2% | +3% | — | Supported by positive sales growth in EACH year |
| 5. Revenue | $561M | $653M | $724M | +14% | Compounded at a 14% growth rate, up from $561M to $724M |
| 6. Normalized EBITDA | $287M | $333M | $375M | +14% | Normalized EBITDA grew at that same 14% CAGR |
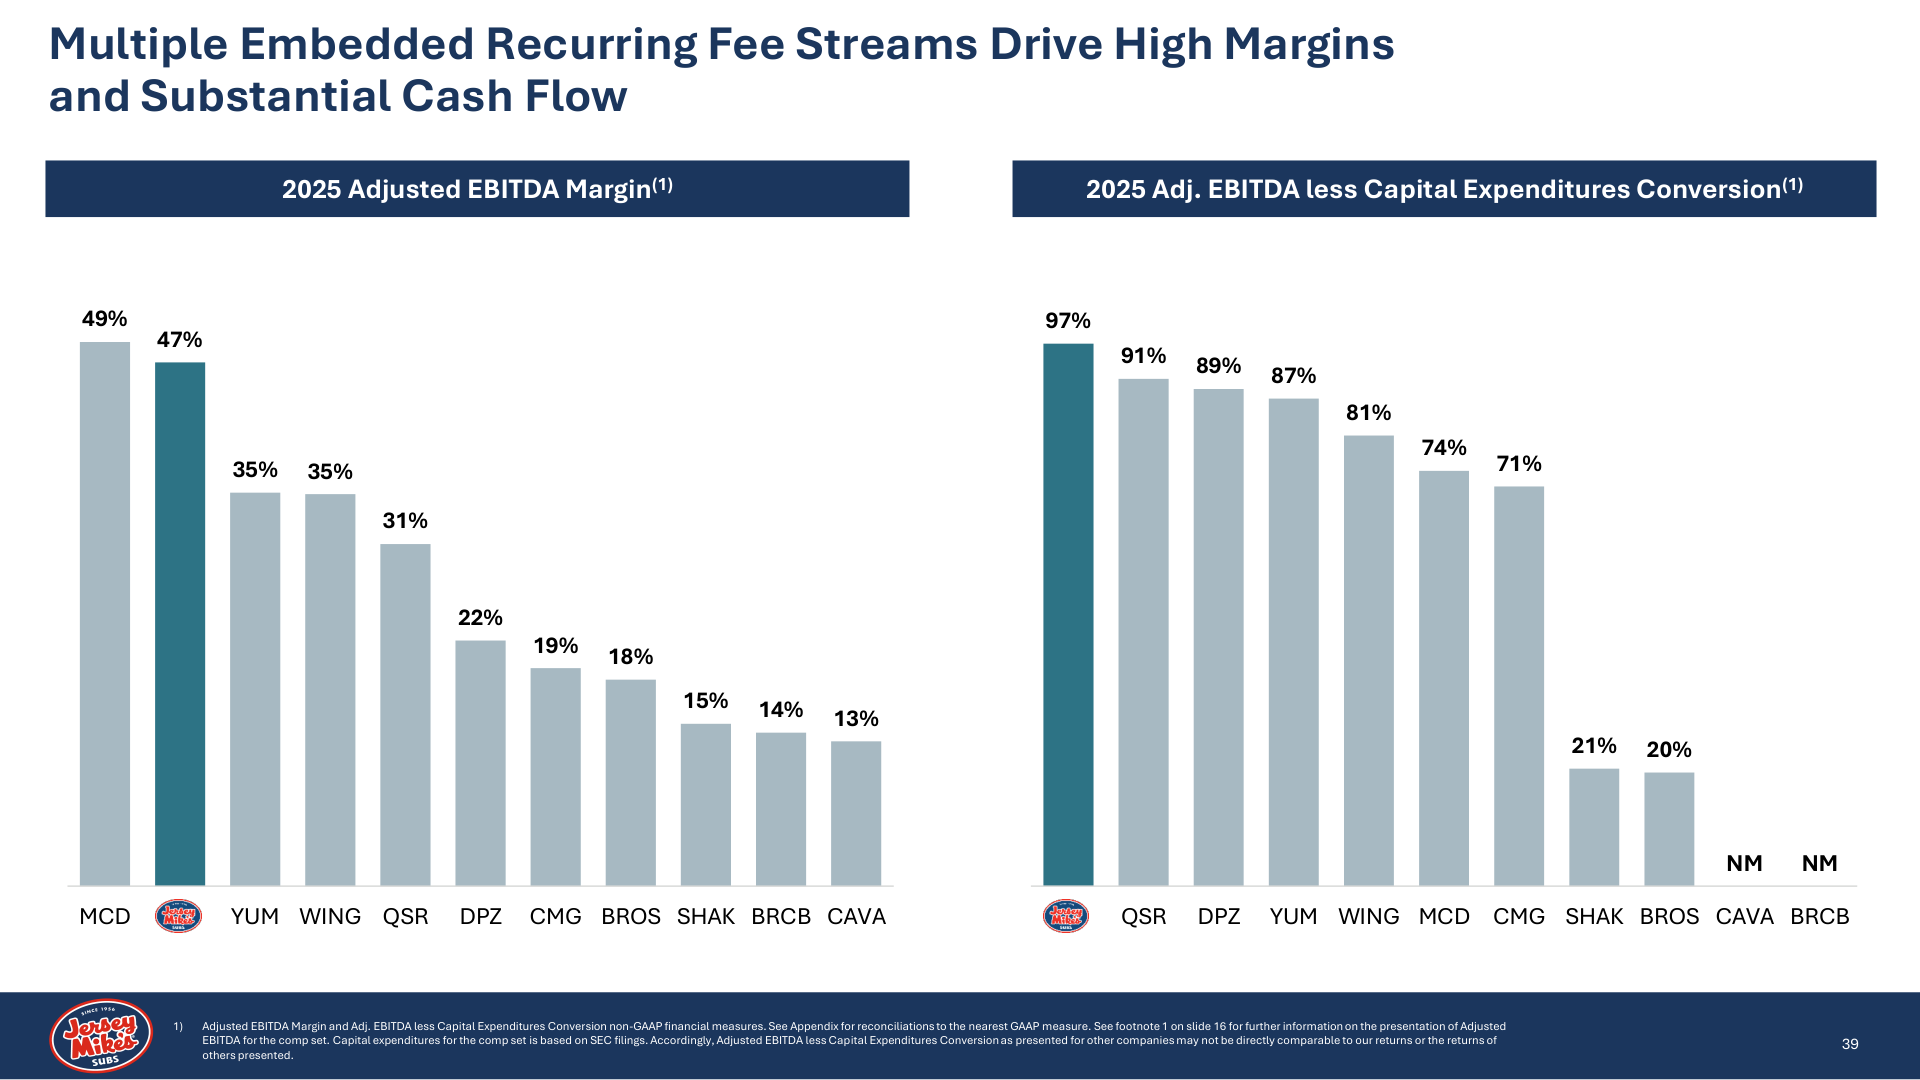
| 7. EBITDA less CapEx Conversion | 96% | 95% | 97% | — | You can see strong conversion into free cash flow in all three years |
🎬 GFX 19 — Flujo de Animación en 2 Fases (Textos en Pantalla) Motion Design Specs
Para evitar saturación visual con 7 datos a la vez, la animación se divide en dos fases conectadas por un texto-puente:
- • Systemwide Sales: $3.3B ➔ $4.2B (+26%)
- • Store Count: 3,256 (+21%)
- • AUVs: $1.36M (Expanded)
- • Same-Store Sales: Positive Each Year
- • Revenue: $561M ➔ $724M (14% CAGR)
- • Normalized EBITDA: 14% CAGR (Efficient Growth)
- • EBITDA to FCF Conversion: Strong Conversion (97%)
Especificaciones de diseño, timecodes, voice-over y slides de referencia para los 7 entregables financieros de Pablo. Haz clic en **cualquier fila** para ver el slide ampliado junto a sus datos en la tarjeta de detalle. Las columnas son redimensionables arrastrando los bordes de los encabezados.
| GFX / Estado | Título / Concepto |
|---|---|
| GFX 7 Aprobado |
2025 ADJUSTED EBITDA MARGIN
📅 Esperado: 30 Jun
📤 Entregado: 02 Jul (V2)
|
| GFX 10 Entregado |
SYSTEMWIDE AVERAGE UNIT VOLUME
📅 Esperado: 30 Jun
📤 Entregado: 02 Jul
|
| GFX 15 Entregado |
REVENUE & EBITDA GRAPH
📅 Esperado: 30 Jun
📤 Entregado: 02 Jul
|
| GFX 17 Con Ajustes |
2025 ADJ. EBITDA LESS CAPEX CONVERSION
📅 Esperado: 02 Jul
📤 Entregado: 02 Jul
|
| GFX 18 Con Ajustes |
BALANCE SHEET HIGHLIGHTS
📅 Esperado: 02 Jul
📤 Entregado: 03 Jul
|
| GFX 19 Pendiente |
3-YEAR FINANCIAL PERFORMANCE
📅 Esperado: 03 Jul
📤 Entregado: 03 Jul (Hoy)
|
| GFX 21 Pendiente |
GROWTH ALGORITHM
📅 Esperado: 03 Jul
📤 Entregado: 03 Jul (Hoy)
|
Propuesta de costos reestructurada basada en la complejidad individual de animación para cada gráfico financiero (desglose por entregable, pre-factura automática y pagos asociados).
Desglose de Presupuesto por Complejidad de Slide
| Entregable | Horas Est. | Costo Prop. |
|---|---|---|
| Pre-producción | 4 h | $300.00 USD |
| GFX 7 | 4 h | $300.00 USD |
| GFX 10 | 4 h | $300.00 USD |
| GFX 15 | 4 h | $300.00 USD |
| GFX 17 | 2 h | $150.00 USD |
| GFX 18 | 5 h | $375.00 USD |
| GFX 19 | 5 h | $375.00 USD |
| GFX 21 | 4 h | $300.00 USD |
| Project Management | 4 h | $300.00 USD |
| 36 h | $2,700.00 USD |
💰 Resumen Financiero
Estado de Hitos
Presentación ejecutiva original de inversión utilizada para el Roadshow del video.
Resumen de briefing de tomas, minutaje e indicaciones técnicas para los animadores de Jersey Mike's.
| GFX | Asignado a | Referencia / Slide | Indicaciones & Notas de Animación |
|---|---|---|---|
| GFX 1 | Brendan | Slide 6 en deck TTW | “We are one of the fastest growing, restaurant brands in the US with an iconic history...” Algún tipo de banner que correlacione con el slide 6 del deck TTW. |
| GFX 2 | Bill | Slide 11 gráfico de mix, TC: 01:02:41:23 | Gráficos de pastel de mezcla de partes del día y mezcla de ocasiones. El gráfico de pastel de partes del día se construye primero, escala las secciones cuando se mencionen... |
| GFX 3 | Bill | Slide 12 gráfico de crecimiento, TC: 01:03:34:06 | Gráfico de crecimiento de ventas en mismas tiendas. Transición al gráfico AUV. Destacar la columna de 4.2 Billones... |
| GFX 4 | Chris | Slide 14 Mapa de EE.UU., TC: 01:04:41:06 | Zoom del mapa en Carolina del Norte y mostrar la placa de $1.4M AUV... |
| GFX 5 | Bill | Slide 15 gráfico de Vintages, TC: 01:05:05:00 | Clases de Vintage apareciendo en pantalla en ráfagas rápidas primero, ralentizándose para las últimas clases... |
| GFX 6 | Brendan | Slide 32 métricas | Métricas de tienda: comida/papel 27%, mano de obra en los bajos 20s, EBITDA 28% estilo cilindro giratorio... |
| GFX 7 | Pablo | Slide 39 gráfico izquierdo, TC: 01:07:12:12 | Gráfico de Margen EBITDA Ajustado 2025. Las columnas se despliegan. Destacar el margen EBITDA del 47% de Jersey Mike's... [TU ENTREGABLE #1] |
| GFX 8 | Franchise Owner | General | Mike decidirá una forma alternativa de transmitir que la mayoría de los propietarios operan < 2 tiendas... |
| GFX 9 | Chris | Slide 32 Month of Giving, TC: 01:09:01:18 | Collage de fotos en el estilo característico de Krispy Kreme... |
| GFX 10 | Pablo | Slide 26 AUV a 2M, TC: 01:10:11:09 | Comienza con la columna superior azul marino de 2M. Luego se llena a 3/4 de color rojo cuando se menciona 1.4M. La etiqueta inferior se transforma al 28 de diciembre de 2025... [TU ENTREGABLE #2] |
| GFX 11 | Brendan | Citas contra broll | “We love the deli-style subs... Give us more flavor...” |
| GFX 12 | Chris | Collage de innovación del menú, TC: 01:10:57:21 | Diapositivas LTO de Mike's Hot Italian, combo de Boardwalk, Chicken Salad Sub... |
| GFX 13 | Chris | Slide 33 Mapa de Whitespace en EE.UU., TC: 01:13:40:15 | Mapas de espacio en blanco, destacar Medio Oeste Superior, Noreste, luego girar el globo para Canadá, Reino Unido, Europa Occidental... |
| GFX 15 | Pablo | Slide 38 gráfico izquierdo, TC: 01:16:14:10 | Gráfico de CAGR de ingresos. GFX 16 (margen operativo EBITDA) fusionado en este gráfico... [TU ENTREGABLE #3] |
| GFX 17 | Pablo | Slide 39 gráfico derecho, TC: 01:16:41:07 | EBITDA 2025 menos conversión de CapEx 97% de flujo de caja libre... [TU ENTREGABLE #4] |
| GFX 18 | Pablo | Slide 41 estadísticas del lado izquierdo, TC: 01:17:03:03 | Métricas de deuda y tasa de interés. Construir elementos en pantalla como botones en azul de Jersey Mike's... [TU ENTREGABLE #5] |
| GFX 19 | Pablo | Slide 42 tabla izquierda, TC: 01:17:03:03 | Rendimiento de 3 años hasta EBITDA Normalizado. Resaltar estadísticas cuando se mencionen... [TU ENTREGABLE #6] |
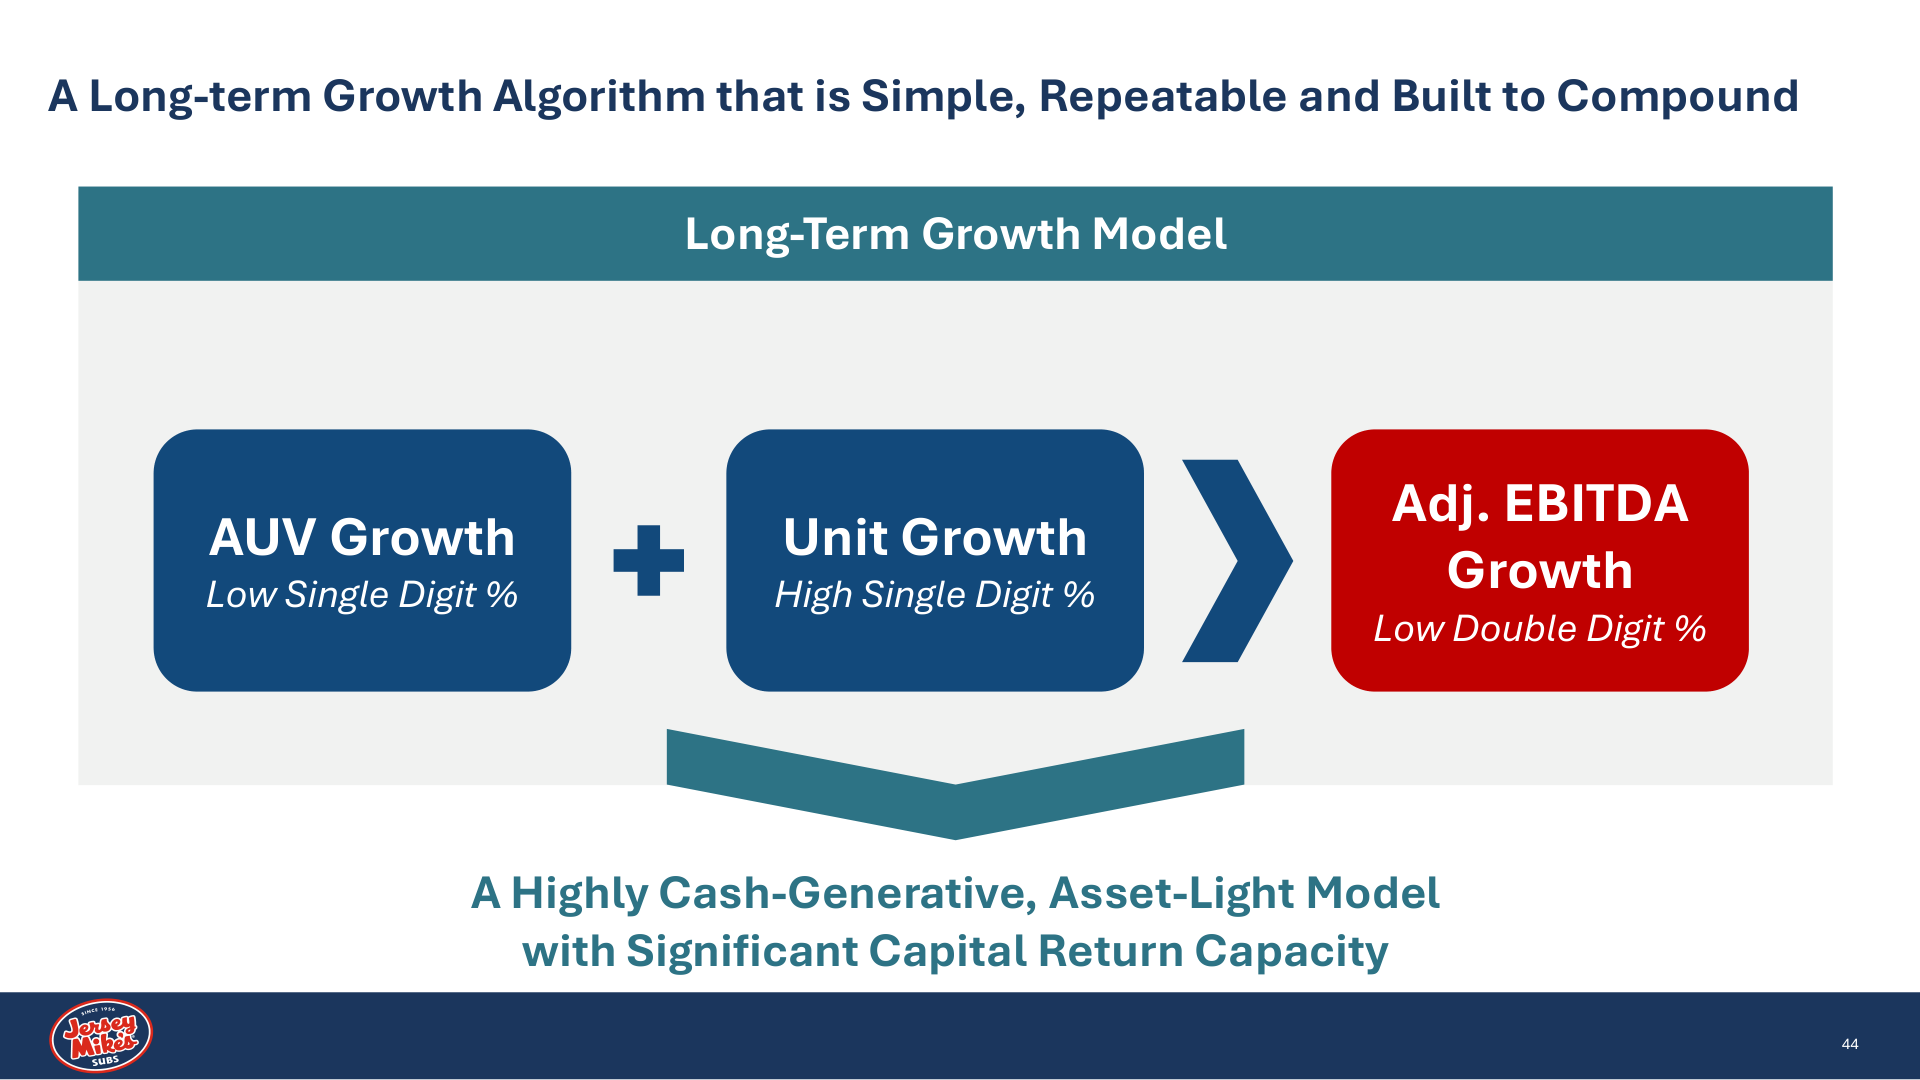
| GFX 21 | Pablo | Slide 44 algoritmo, TC: 01:19:00:18 | Construcción de métricas del Algoritmo de Crecimiento sobre fondo sólido... [TU ENTREGABLE #7] |
🎬 Full Video Script
Contenido ActivoTabla de transcripción de voz de locutor y placeholders visuales con imágenes de referencia integradas en alta definición.
| ID | Referencia | Locución (Talking Points) | Notas & Referencias Visuales |
|---|---|---|---|
| 1 | Intro Charlie Morrison | What’s happening at Jersey Mike’s today is incredibly exciting. This is a scaled, growth brand with significant white space ahead, decades in the making. I’m Charlie Morrison, CEO of Jersey Mike’s. I’ve spent my career in restaurants and have had the privilege of leading some iconic and beloved brands. When Blackstone acquired this business in early 2025, they called me to lead Jersey Mike’s into its next chapter, and I can’t tell you how excited I am to share this amazing story. But this story started a long time ago, on the Jersey shore when an ambitious teenager, working at a local sub shop had an idea to own something of his own…. | Recording of Charlie |
| 2 | Peter Cancro Video | [TBD] | Q&A Type of Format with Peter Going through the history |
| 3 | Intro Continued Charlie Morrison | We are one of the fastest growing, scale d restaurant brands in the US with an iconic history Our robust operating platform delivers subs that are the highest quality and always fresh Our operating model generates strong unit economics and cash-on-cash returns For the last 20 years, we have produced consistent unit growth and positive same-store sales We have significant whitespace to grow both in the US and internationally Finally, our asset-light, franchise model requires minimal CapEx and offers highly predictable streams of revenue | [Charlie ticks through the investment highlights with each showing up on the screen to the right – slide 6 from the TTW] 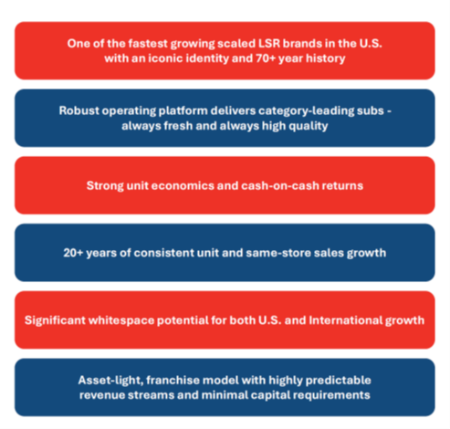 image1.png image1.png |
| 4 | The Brand and Product Charlie Morrison | Jersey Mike’s is anchored on those classic cold American-style subs we’ve all grown to love, but there’s really something for everybody on our menu. It spans the spectrum: cold subs, hot subs, our cheesesteaks, which I would put up against anybody, tuna, roast beef, you name it. Carb-conscious and don’t want all that bread? No worries. Every sub can be made into a bowl. Looking for a lighter option to meet dietary preferences? Every sub can be made into a mini. And it’s complemented by a catering business that’s still emerging at only 3% of system sales today, with potential to reach 10% as we grow. | Start with this picture followed by pictures of the menu and subs mentioned by Charlie 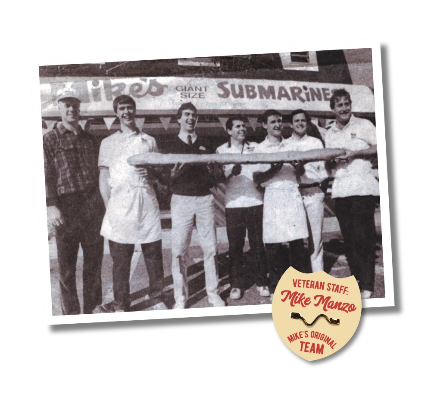 image2.png image2.png |
| 5 | Broad Consumer Appeal Charlie Morrison | That menu is supported by broad consumer appeal. Historically, we’ve pointed most of our advertising at a core customer who loves deli-style subs: generally older, higher income, and leaning male. In one sense, that insulates us from today’s economically challenged consumer. In another, it’s a huge opportunity, especially with the Gen Z consumer, a much more diverse audience that loves sub sandwiches and uses Jersey Mike’s, just not as often as they should. The real reason has everything to do with our historical approach to advertising, which we’ll come back to. | Slide from TTW with the bar charts of the customer demographic + video footage of customers in the store ordering that represent the demographic 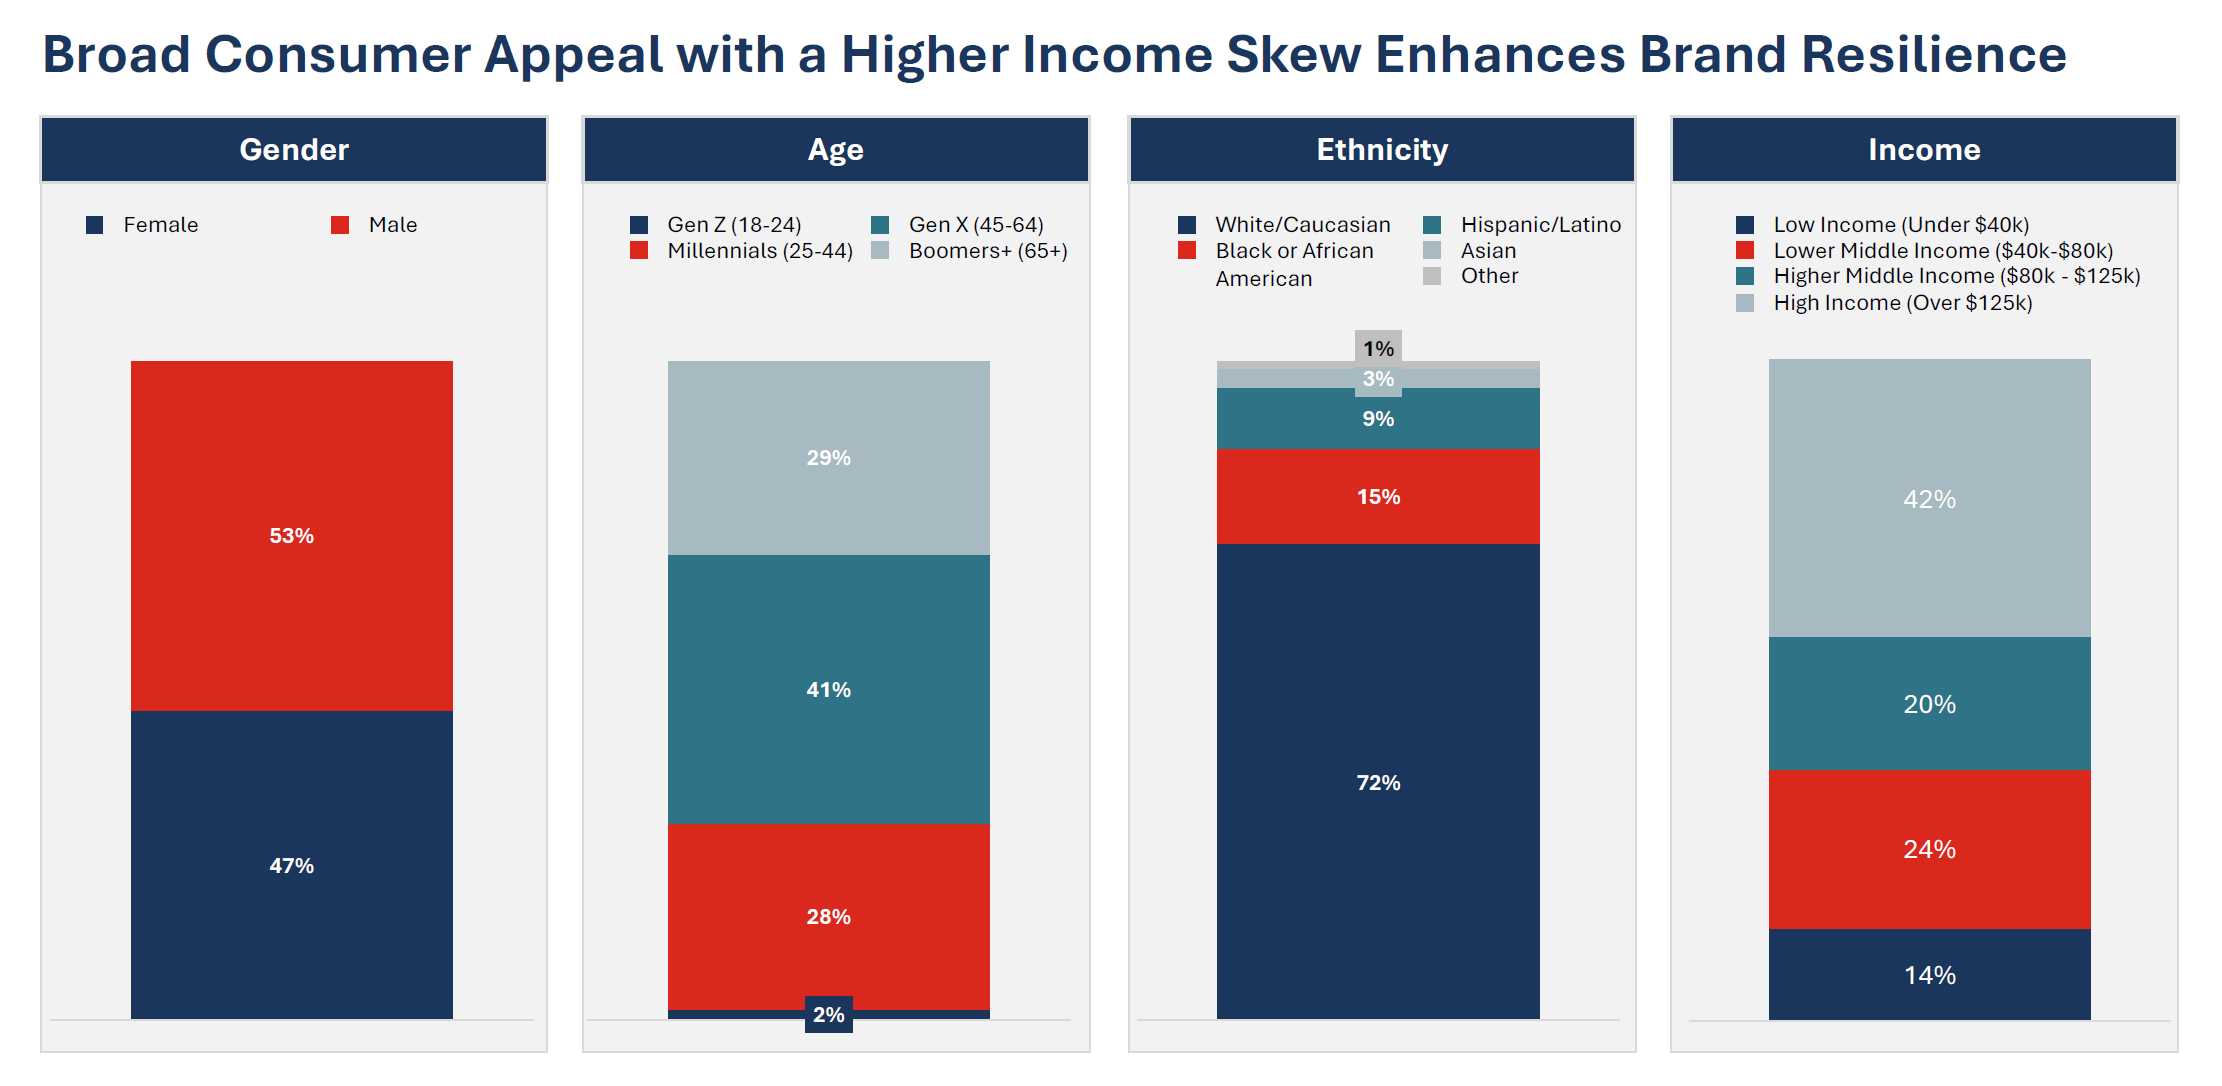 image3.png image3.png |
| 6 | Balanced Day Parts & Digital Strength Charlie Morrison | We also enjoy a very balanced day-part mix. Sandwiches skew to lunch, but our dinner business is almost 30% of sales, with a nice afternoon snack business too. And we close at 9 p.m. across the country, so there’s a ripe late-night opportunity with that younger customer, especially through digital ordering. Our proprietary, scaled technology platform drives that digital business: today it’s 42% of sales, split evenly between pickup and delivery. We believe digital can reach 60% or more with more contemporary marketing. Most of our delivery today is third-party, with the DoorDash and Uber Eats of the world, with very little first-party through our own app and channels. So there’s real upside on both fronts: we can more than double our online orders for pickup and meaningfully grow first-party delivery. | Pie Charts of Day Parts and Digital Split 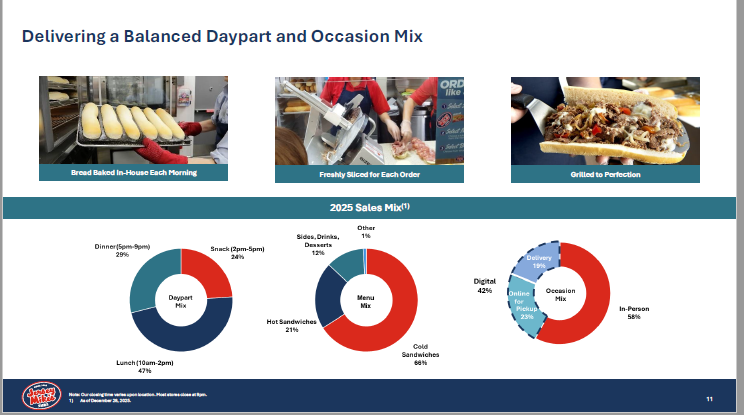 image4.png image4.png |
| 7 | Unmatched Track Record & Scaled Marketing Charlie Morrison | We have an unmatched track record. We’re the only brand that can cite 20 consecutive years of positive same-store sales growth, and we’re still growing comps in the first half of 2026, driven primarily by transaction growth . We have produced consistent AUV growth, over $4.2 billion in system-wide sales, and a $200 million-plus marketing fund. While we took outsized pricing 2022 and 2023 to offset higher post-pandemic inflation , we were able to hold flat-to-positive transaction counts , truly differentiated performance in the fast-casual segment . Our Ad Fund is anchored by the great Danny DeVito, New Jersey’s own, who’s helped drive more than 90% aided awareness, best in class. The opportunity now is to convert awareness into frequency: we have over 12 million active l oyalty members, on the way to more than 50 million over time. | Bar Chart of Rising AUVs and System Wide Sales Chart 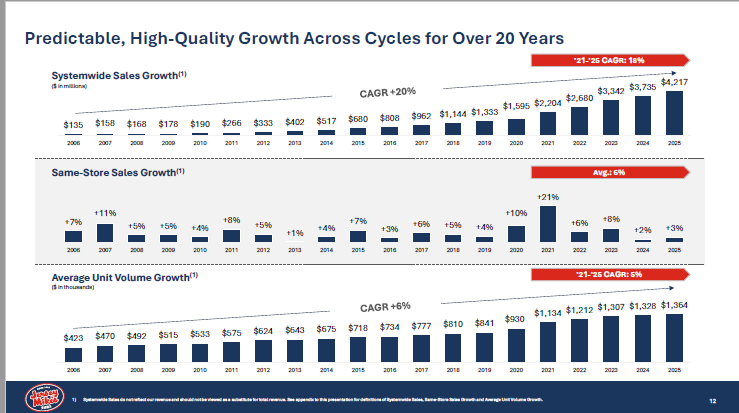 image5.png image5.png |
| 8 | Portability, Predictability & Vintages Charlie Morrison | A brand looking to enter the public market must be both predictable and portable , which is what I love about Jersey Mike’s . No matter the region, the brand travels. Our highest level of concentration is in North Carolina, about 50,000 people per store, and even there , AUVs sit right at the brand average of $1.4 million and same-store sales remain positive, suggesting we have yet to approach the ceiling. That predictability shows up in our vintage performance, too. I’ve been in two brands in my career that can show this, Wingstop and Jersey Mike’s, where each vintage strengthens over time and each new class opens stronger than the one before it . In 2025 and 2026, new vintages opened at or above the system-wide average. Continued strengthening means AUV growth for a long time to come. | Map Page and then Cohort Chart 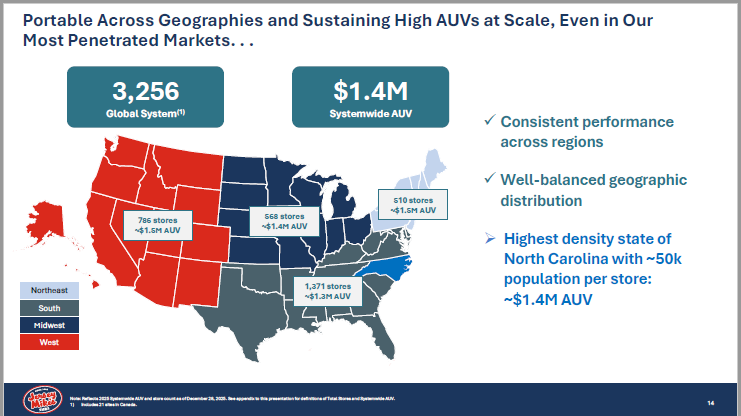 image6.png image6.png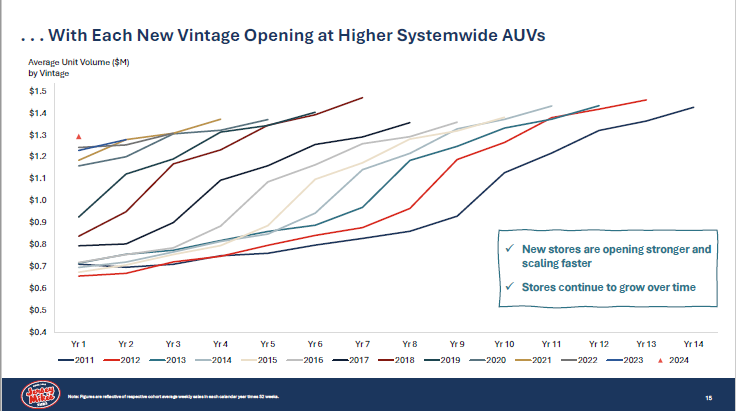 image7.png image7.png |
| 9 | World Class Leadership Team Charlie Morrison | To get here, we’ve built a world-class team that’s public-company ready, and with a few of them we are bringing the band back together . Stacy Peterson, our President, was with me throughout my time at Wingstop, where she built the technology and marketing platform behind years of outsized growth. Matt Warren, who leads digital marketing, was also critical to our success at Wingstop and is the architect of our one-to-one digital strategy at Jersey Mike’s . Brian Sommers, our Chief Development Officer, has been here more than 25 years and built our 1,600-store pipeline. And Scott Scherer built the proprietary tech stack we’ll continue to grow on. Let me hand it to Stacy to walk through our unit economics. | Can either use a version of the team page from the TTW deck but make it interactive with transitions or perhaps you are filming video snips of each member live/in a group together 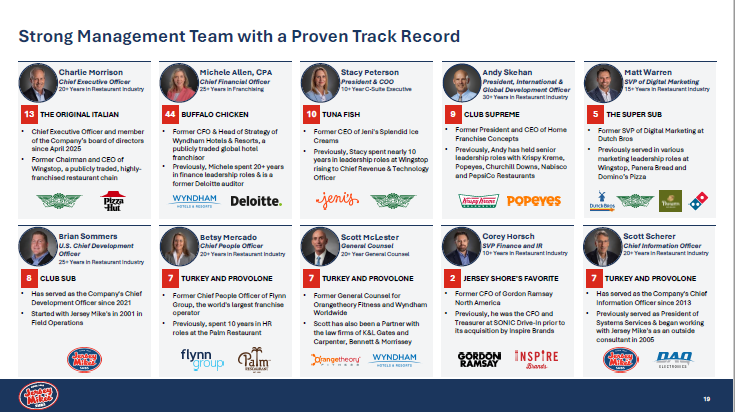 image8.png image8.png |
| 10 | Intro - Maximizing Unit Economics Stacy Peterson | I’m Stacy Peterson, President of Jersey Mike’s. What makes this brand special to operate is the engine underneath it: some of the best unit economics in the industry, and a culture that keeps customers and franchisees deeply loyal. | Recording of Stacy |
| 11 | Best in Class Unit Economics Stacy Peterson | Because our AUVs are so strong, they’re paired with a very efficient P&L that delivers some of the best cash-on-cash returns in the industry. At the store level: food and paper at 27%, labor in the very low 20s, and store-level EBITDA around 28%. That lets us command a top-of-market royalt ies and advertising fees, and it generates remarkable cash-on-cash returns that have room to grow as AUVs expand. Those returns are the engine of everything that follows: they’re why our franchisees keep reinvesting, and why demand to build new stores stays so strong. | Can use the P&L page from TTW or have the numbers pop up on the screen as she is walking through 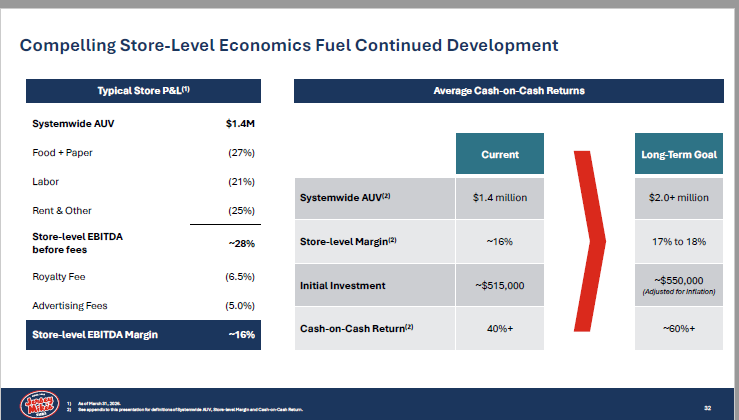 image9.png image9.png |
| 12 | Contemporary Franchise Model Stacy Peterson | And our economics extend well beyond royalties, what Charlie calls a contemporary franchising model. We’ve monetized our technology platform and benefit from supply chain economics, and that layered revenue drives a top-of-industry 47% EBITDA margin, second only to McDonald’s and well above other highly successful franchise brands . | Chart from TTW deck 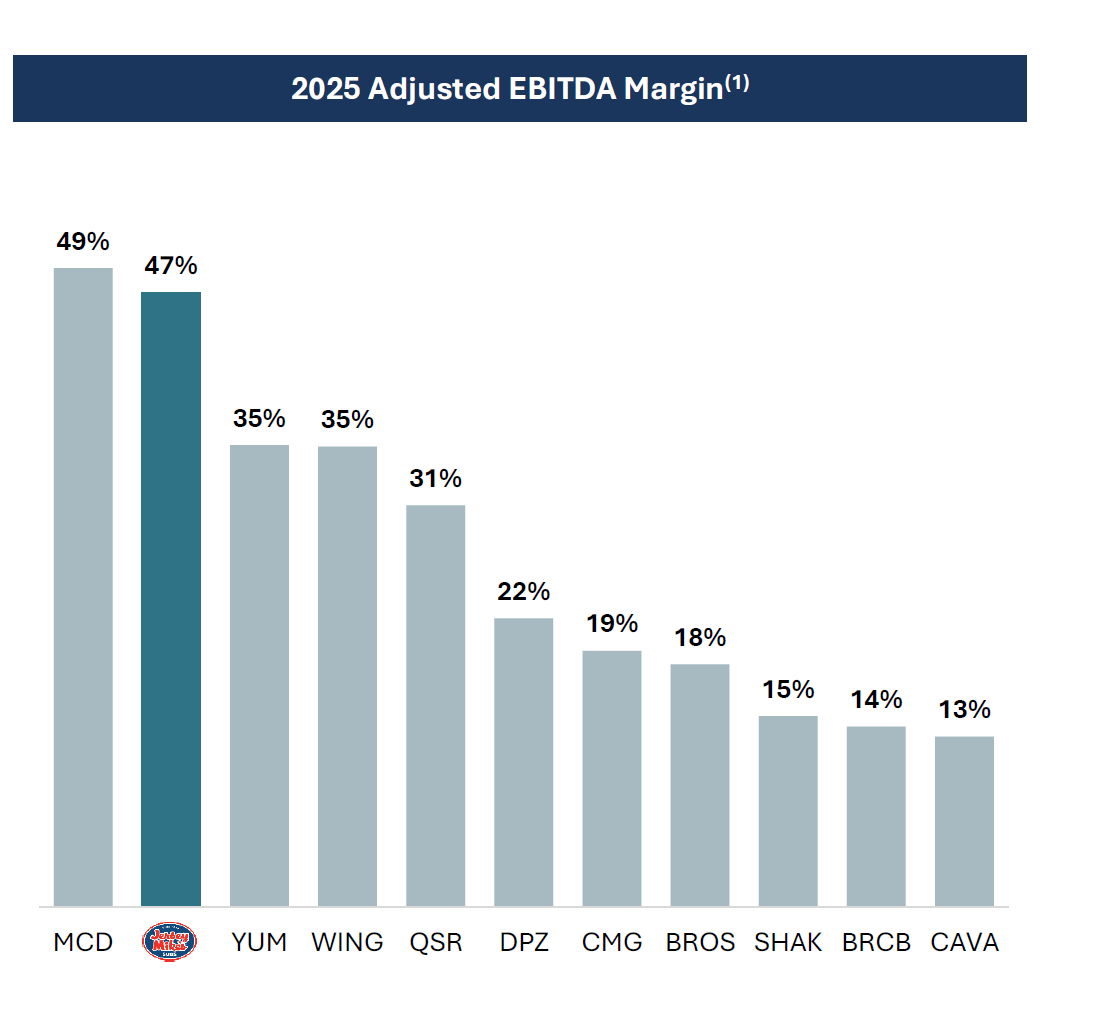 image10.png image10.png |
| 13 | The Flywheel is Already Turning Stacy Peterson | The flywheel is already turning fast. Most brands have to grow AUVs, earn franchisee reinvestment, and only then build a scaled marketing platform. We’ve already got it: over $200 million in advertising spend, growing with system sales every year. That’s a big part of our growth engine . | Recording of Stacy |
| 14 | Franchisee Demand & Development Pipeline Stacy Peterson | And our franchise owners want to grow. It’s a diverse base. Most operate fewer than two stores, and even our top 10 average just 60. Two opportunities stand out. First, existing franchise owners represent over 90% of our 1,600-store pipeline that we can build over the next five years at our current pace. Second, there’s room for consolidation, so owners who want to grow can acquire stores from within the system, simplify scale, and open up new territories. | TTW Deck 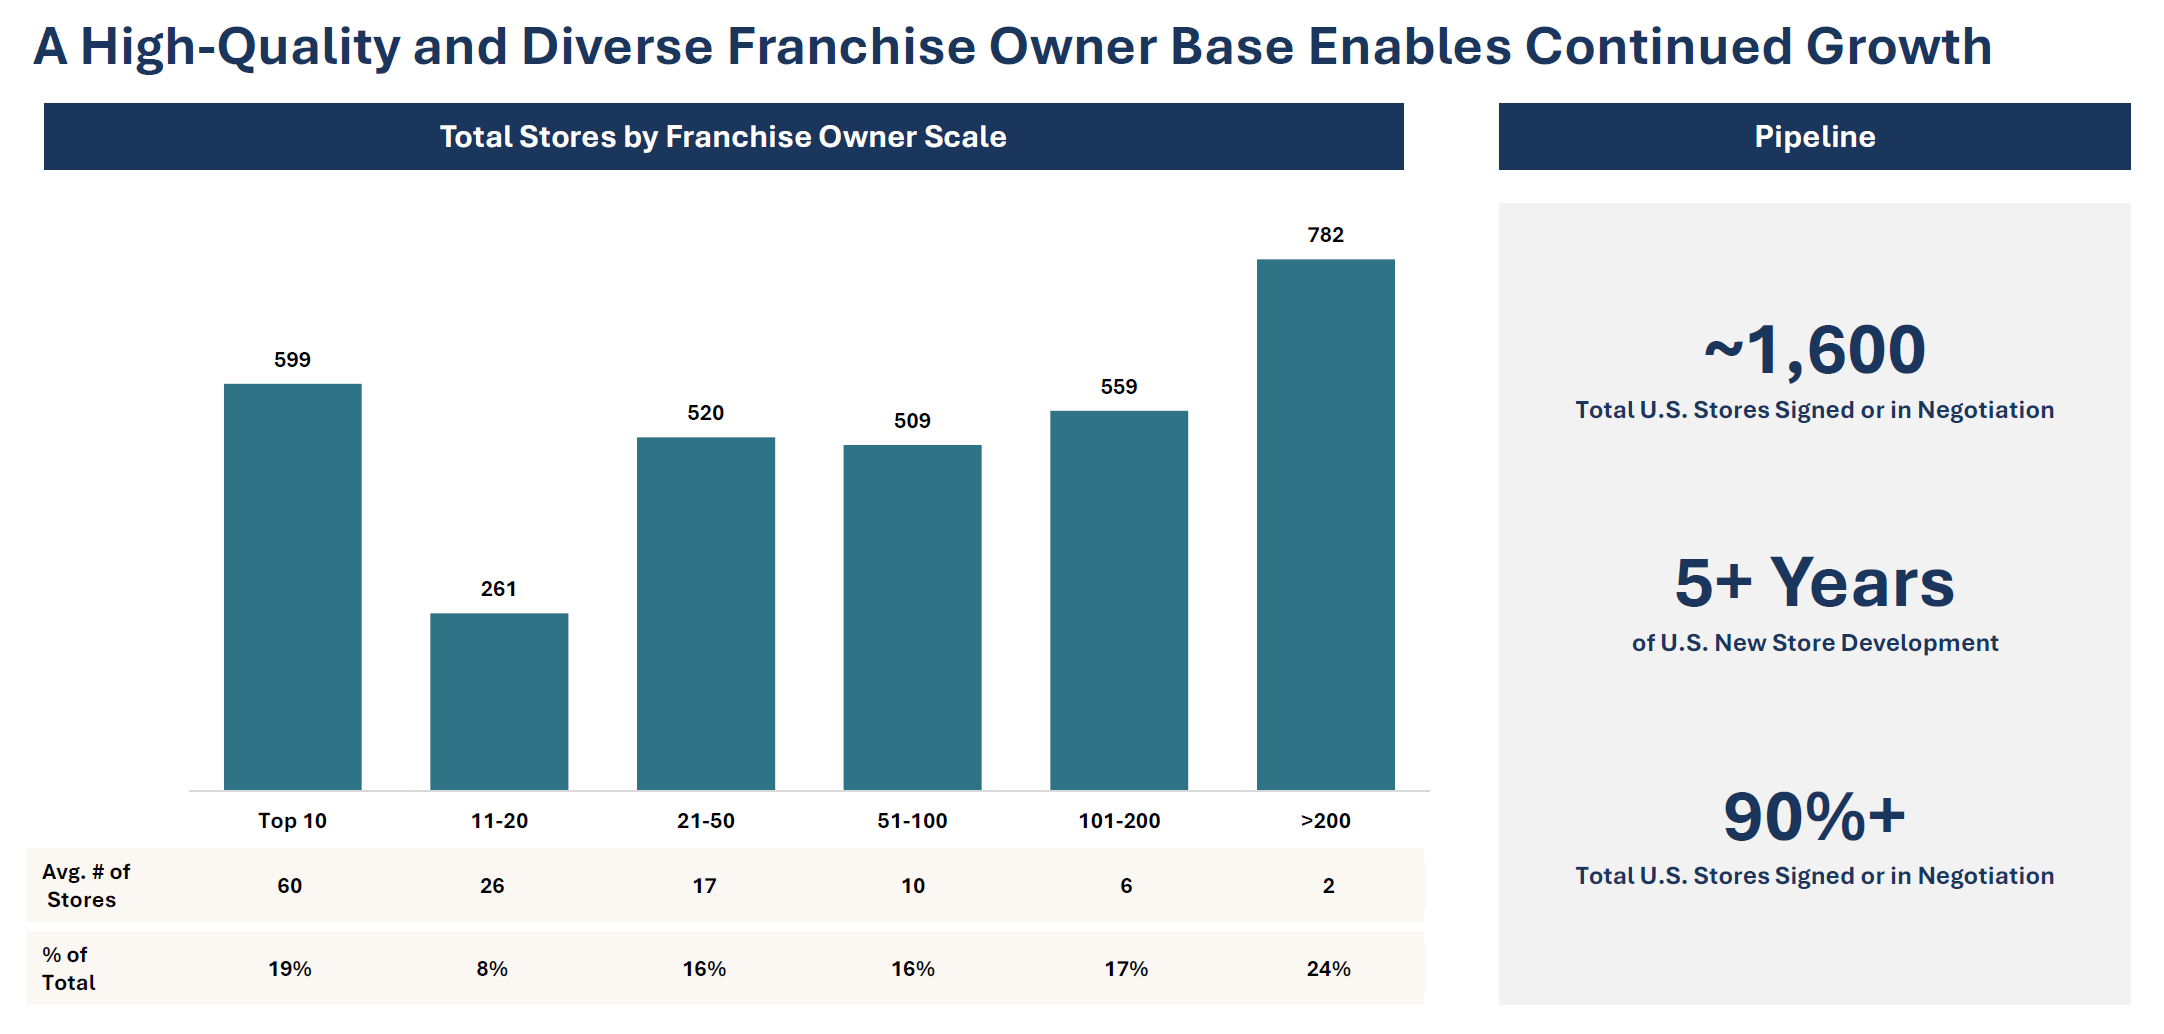 image11.png image11.png |
| 15 | Community & Our Culture of Giving Stacy Peterson | Underpinning all of it is our culture. Our NPS exceeds sandwich-category peers by more than 47%, and team-member engagement is 85%. We recently knocked off Chick-fil-A as the number one ranked quick-service brand in the American Consumer Sentiment Index for 2026, an amazing achievement. People know us for the food and the care we put into it, but also for our giving. Community has been part of who we are since the very beginning. Every March is our Month of Giving, the signature cause campaign we launched back in 2011. It builds all month and culminates in our Day of Giving on the last Wednesday of March, when our franchise owners donate 100% of sales, not their profits, their sales, to charities in their own communities. Each owner curates those local partnerships over time, so the giving stays rooted in the neighborhoods we serve. Since 2011, that effort has raised more than $166 million for local community organizations, and it grows every year. It builds real engagement at the community level, makes Jersey Mike’s one of the most beloved brands in the industry. To show how we take these returns even higher by driving AUVs, here’s Matt Warren. | Month of Giving Clips |
| 16 | Intro - Digital Marketing - Driving AUV Growth Matt Warren | I’m Matt Warren, and I lead digital marketing. Here’s how we drive AUVs from where they are to where we know they can go. Start with where we play: we’re a share taker in the limited-service category. We don’t limit ourselves to sandwich occasions. Against every chain with 1,500-plus stores, we’re outpacing the field on unit and sales growth, taking share across the board, especially in subs. | Recording of Matt |
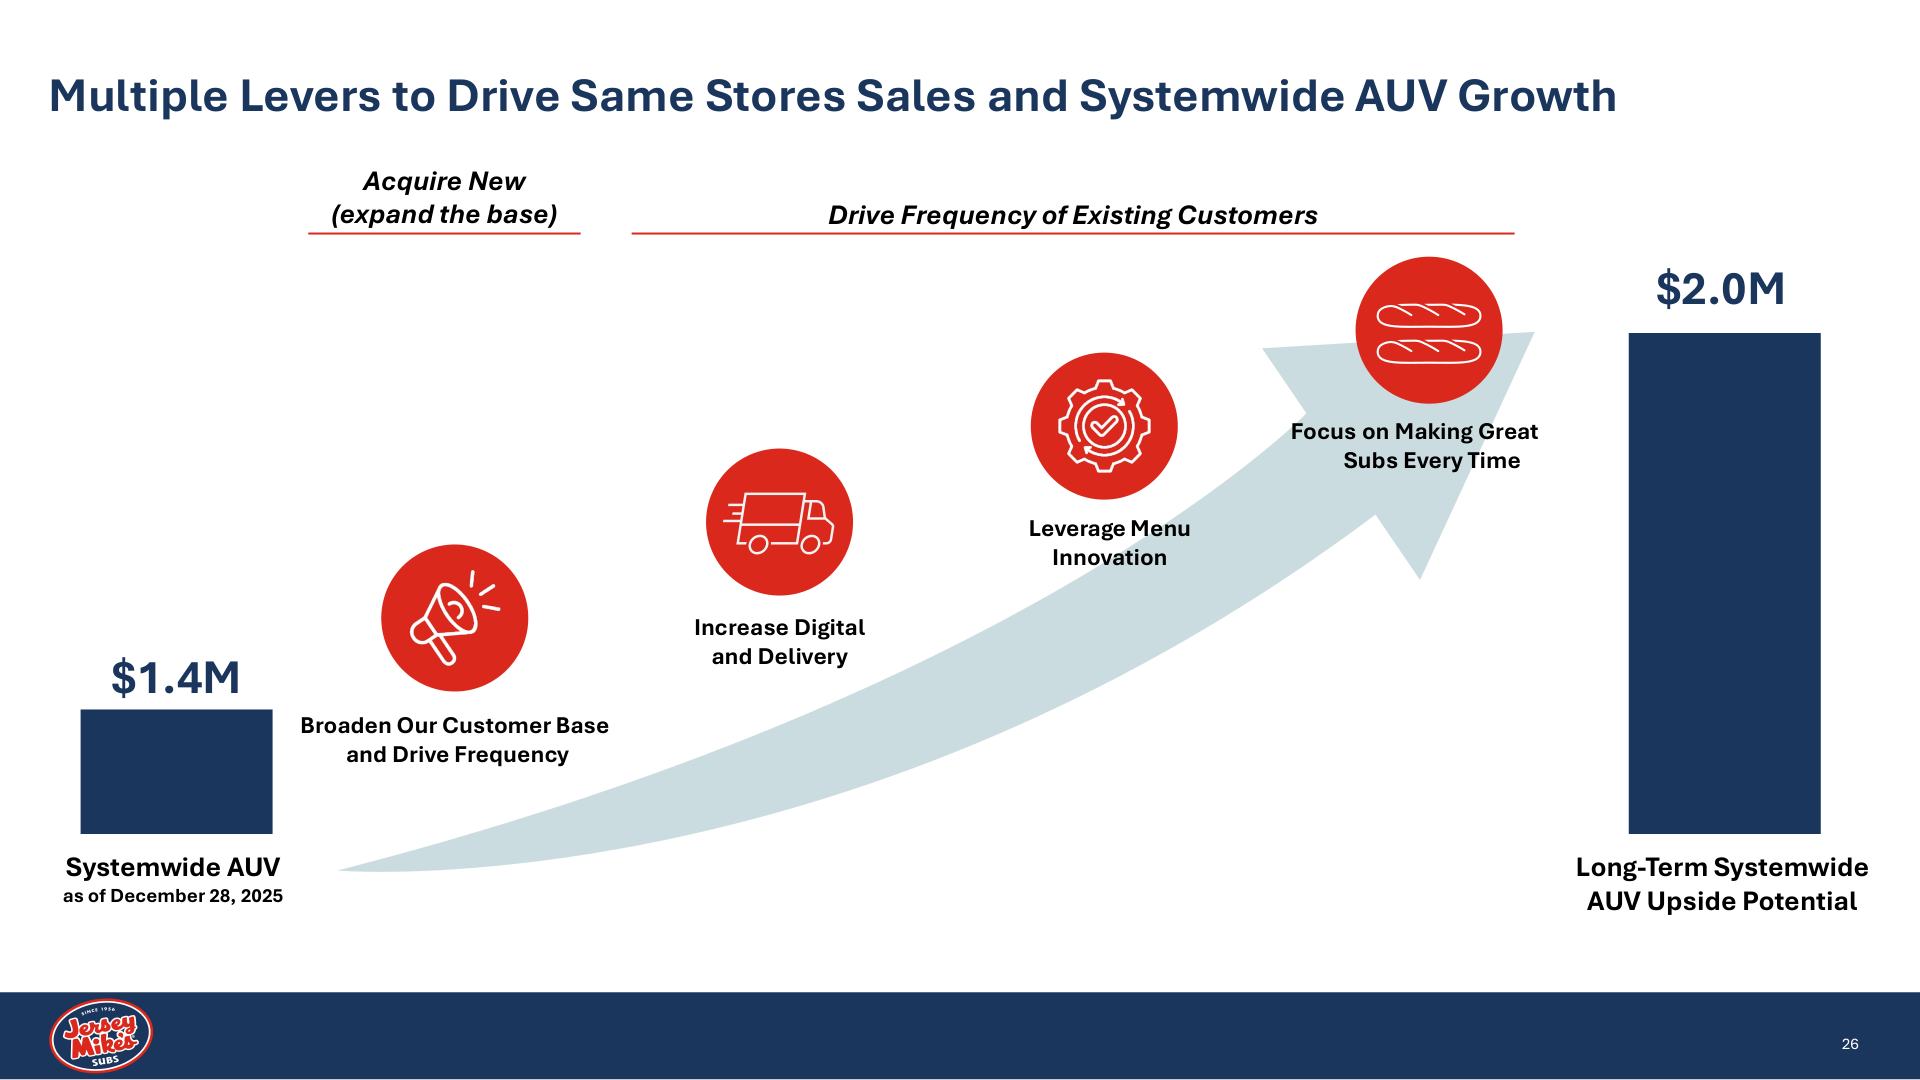
| 17 | The Path to $2 Million AUVs Matt Warren | We believe we can achieve average AUVs of at least $2 million. We’re at $1.4 million today, which already delivers great returns. The unlock is that younger, more diverse customer Charlie described, and spanning the full spectrum of income. It’s the same playbook we ran at prior stops in our careers: leverage our digital channels with innovative ideas and products that appeal to a younger guest and bring them in more often. | Use an upward arrow showing 1.4 to 2MM similar to the image below 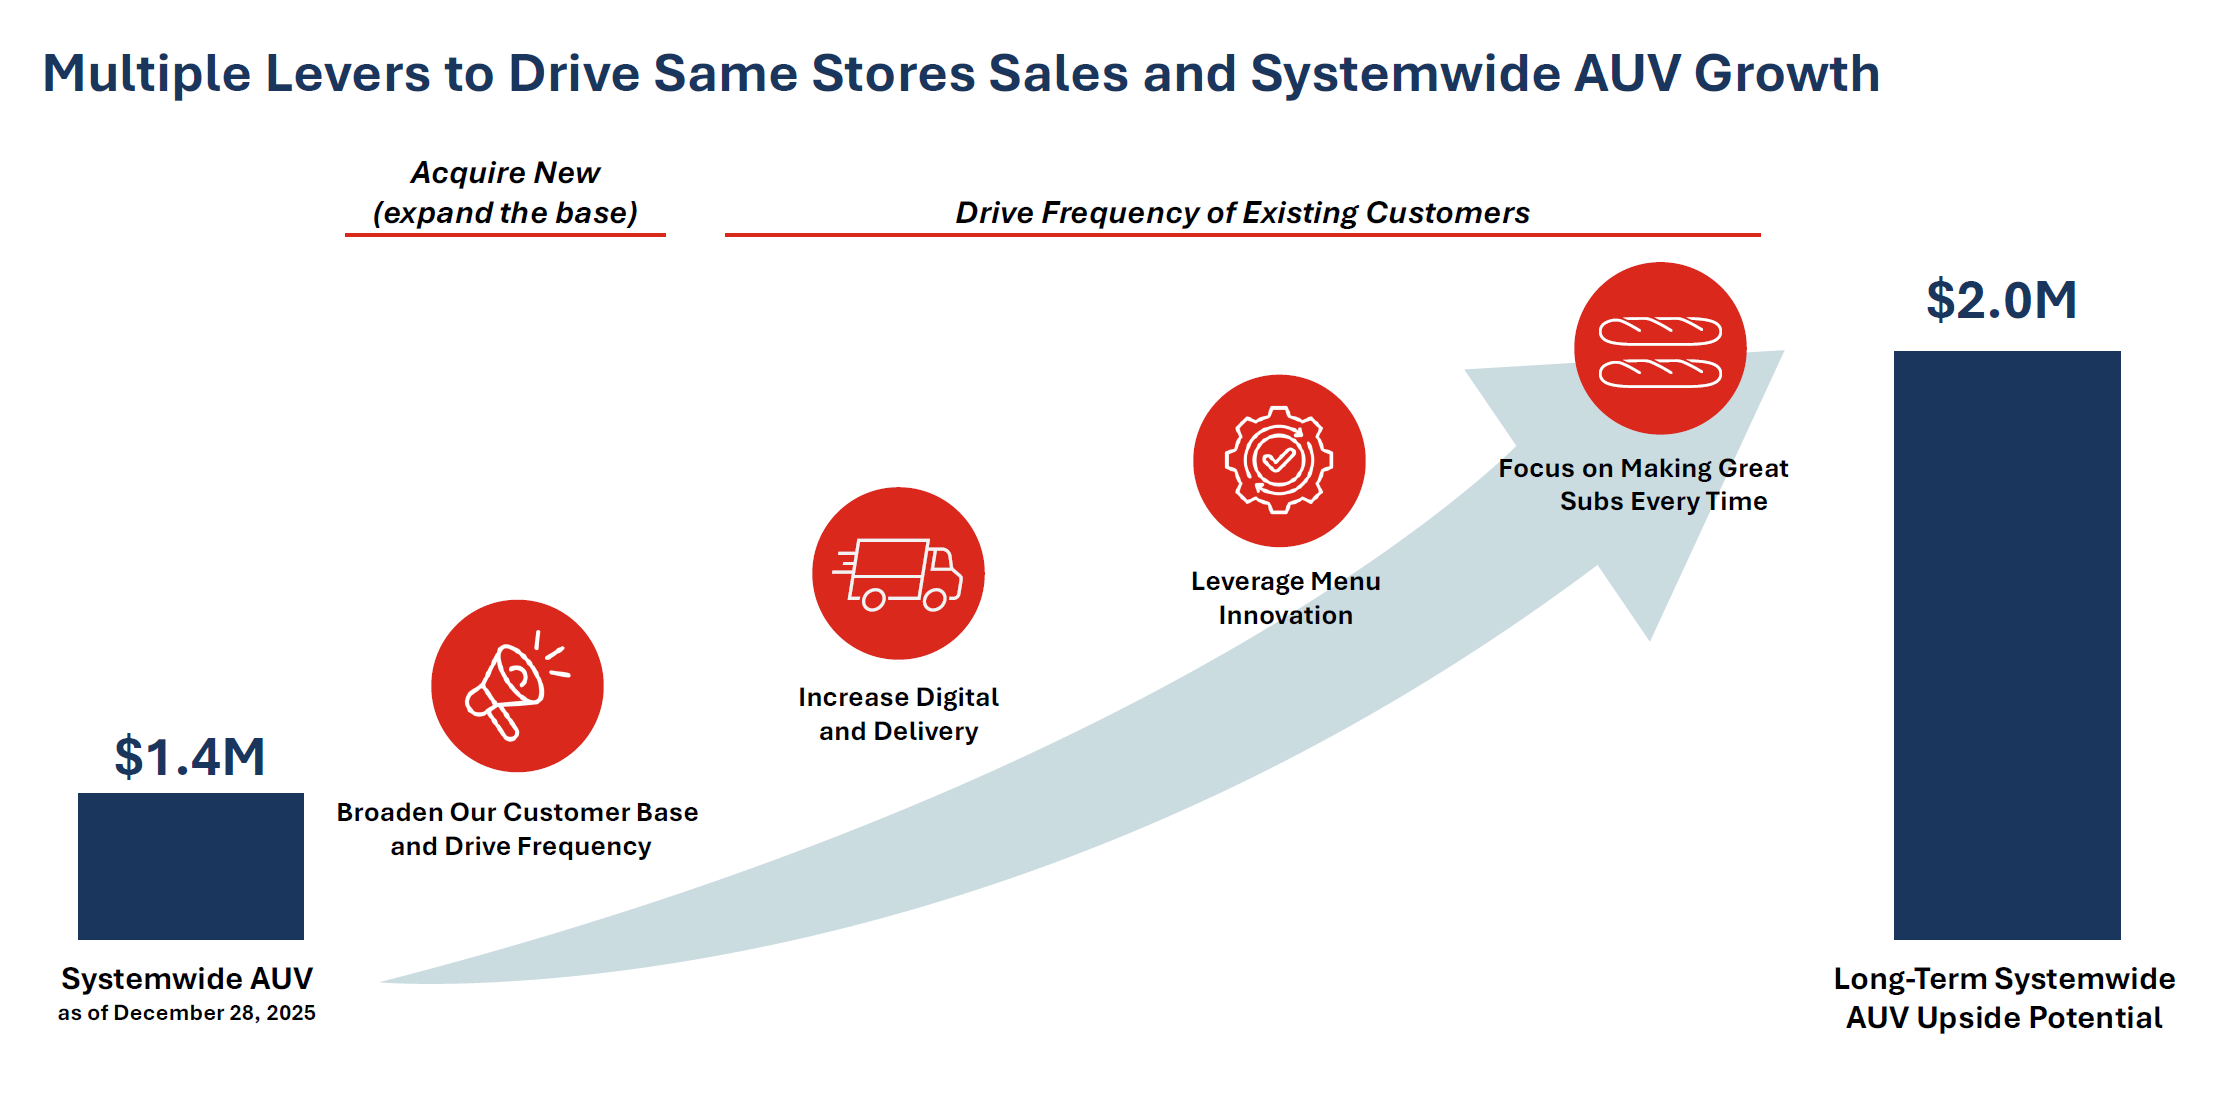 image12.png image12.png |
| 18 | Customer Research Insights Matt Waren | We asked customers directly what they love and what they want. The answer: “We love the deli-style subs, but we get them every once in a while, not every day. Give us more flavor, more innovation, and more ways to invite us in.” So that’s exactly what we’re doing through menu innovation, while keeping every sub at the highest quality, the way we always have. | Have the quotes pop up on screen |
| 19 | Menu Innovation Examples Matt Warren | Mike’s Hot Italian. A hot Italian was once taboo here. We didn’t traditionally put deli meats on the flat grill. But topped with cheese, grilled onions, lettuce, tomato, and our hot pepper relish, it’s a hit. As an early-year LTO, about 50% of buyers were new customers, priced at a value $8.95, with food cost of just 17%. A win-win. The $10.99 Combo. We’d never bundled at a national set price. Chips, a drink, and a sub for $10.99, great value, with a high mix rate. It showed we can flex our value orientation when the consumer is challenged. Chicken Salad Sub. A 2025 fan favorite, back nationally at a value price. The filter on both new builds: minimal new SKUs and little added store complexity. | High Quality Menu Pics with Prices to Flash on Screen – Source from ADP |
| 20 | Customer Segmentation Matt Warren | To target precisely, we segmented our customers in partnership with top media agencies. Two takeaways. First, our Obsessed Customer: older, male-skewing, on our loyalty app, and as frequent as once a month. Second, the bigger opportunity, the Sub Seekers and other sub consumers, younger and digitally connected, living on their phones and iPads, not the linear-TV audience. That second group is the real opportunity, and we know how to bring them into the brand. | 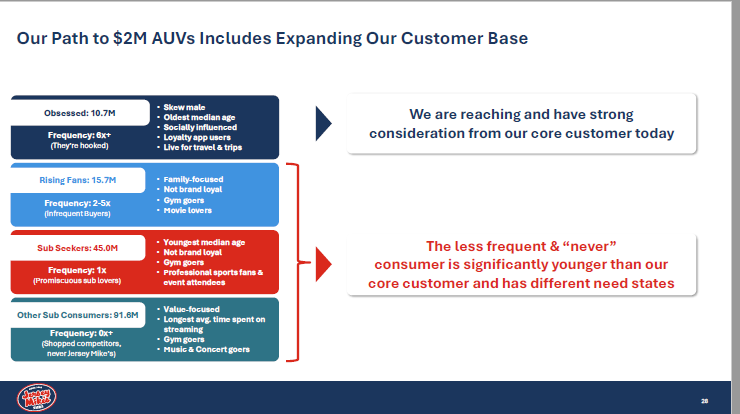 image13.png image13.png |
| 21 | The 1-2-3 of Our Marketing Evolution Matt Warren | Evolve the media mix. We over-indexed on national TV in live sports, and the only digital we really did was organic social, a beautiful shot of someone on the beach in Point Pleasant, New Jersey, watching the waves. We love that, but it’s not what these consumers are looking for. In 2025 we spent on average less than $5,000 a month on paid social, search, and call-to-action digital. Everything was passive. We weren’t even engaging our customers. Invite them in. We use a first-party data strategy to retarget customers, bring them back, and drive frequency. Lead with flavor and craveability. That means the customization they want beyond the standard deli-style sub. | 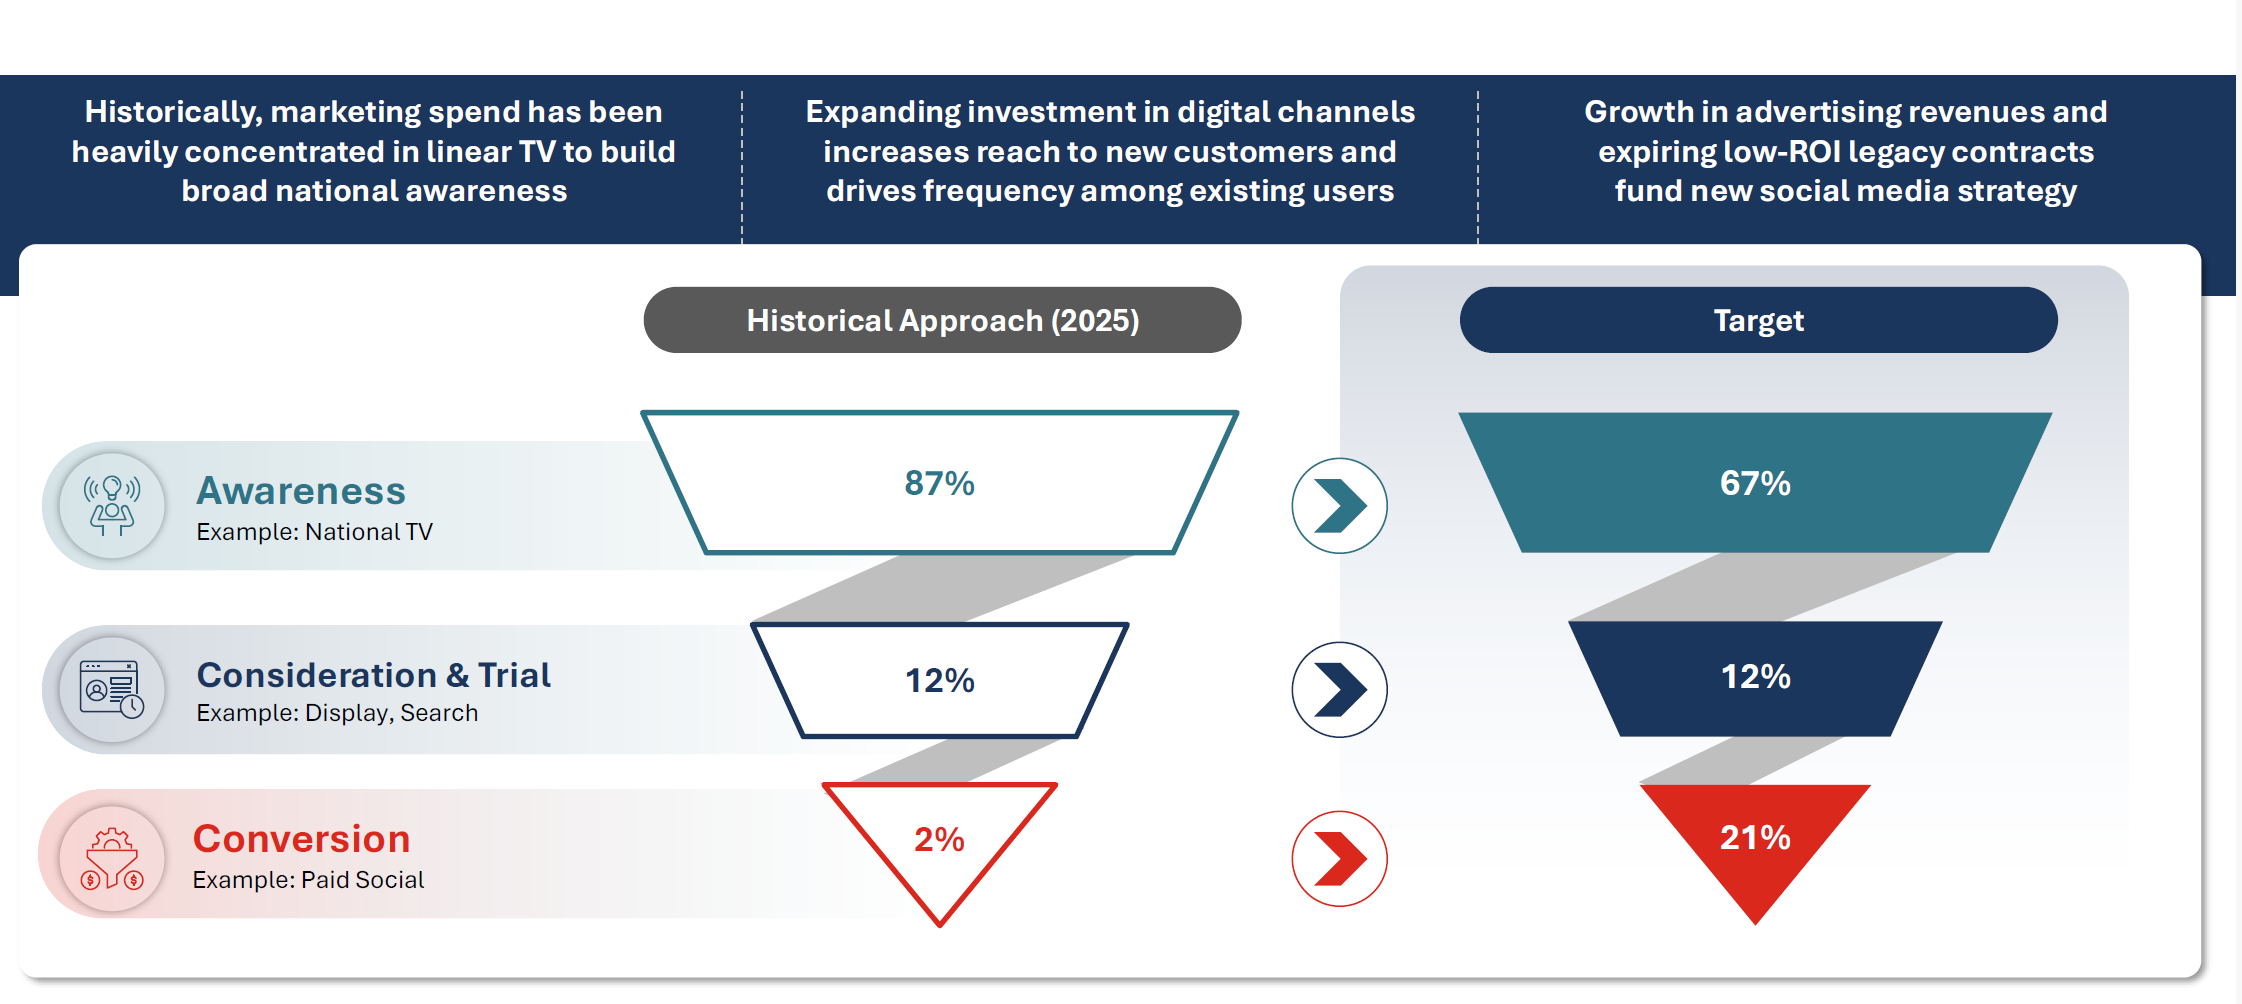 image14.png image14.png |
| 22 | Redistributing the Ad Fund Matt Warren | We’re already redeploying the fund. About $20 million a year —the incremental funds driven by systemwide sales growth — has moved to the bottom of the funnel. We’re still running national TV, but now we work the conversion opportunity in paid social. When we launched Hot Italian, we ran “Try Mike’s Hot Italian for $8.95. Click here to order.” on Facebook and Instagram. It was the first true call to action the brand has ever run in paid social. And here’s the payoff: drive AUV toward $2 million and our cash-on-cash returns can well exceed 60%. That’s why franchisees want to grow with us. Charlie will show how much room we have, at home and abroad. | Include videos or pictures of the LTOs |
| 23 | Expanding our Global Footprint Charlie Morrison | DOMESTIC WHITE SPACE On the runway: outside the Carolinas we have almost no density, and we’re still growing even there. In markets like California, Texas, the Upper Midwest, and the Northeast, we have ample white space . We can responsibly build to more than 7,500 U.S. stores, just over 40,000 people per store. INTERNATIONAL OPPORTUNITY Combine that with international. We worked with Bain to map the world, and the sandwich category has been proven globally, with other brands already having thousands of units. We’re going to come right behind them and show the world what quality is all about. Even in the top - 40 markets, we see another 7,500 stores, a total TAM of over 15,000, roughly 4.6 times our size, far beyond any multi-generational concept out there. CANADA SUCCESS & UK/IRELAND LAUNCH And the good news is, we’re just getting started. In Canada, in only a couple of years we’ve built 21 stores, we’ll likely double that this year, with AUVs exceeding the U.S. average, profitable stores, and a great partner in Redberry. Next is across the pond: the UK and Ireland. Our founder, Peter Cancro, couldn’t sit still in retirement. He’s joining us in the UK, and we already have three locations inked, with first openings soon. From there: the rest of Western Europe, the Middle East, Asia, and Central America over time. A big opportunity for outsized growth. With that, here’s our CFO, Michele Allen. | Canada / Ireland : 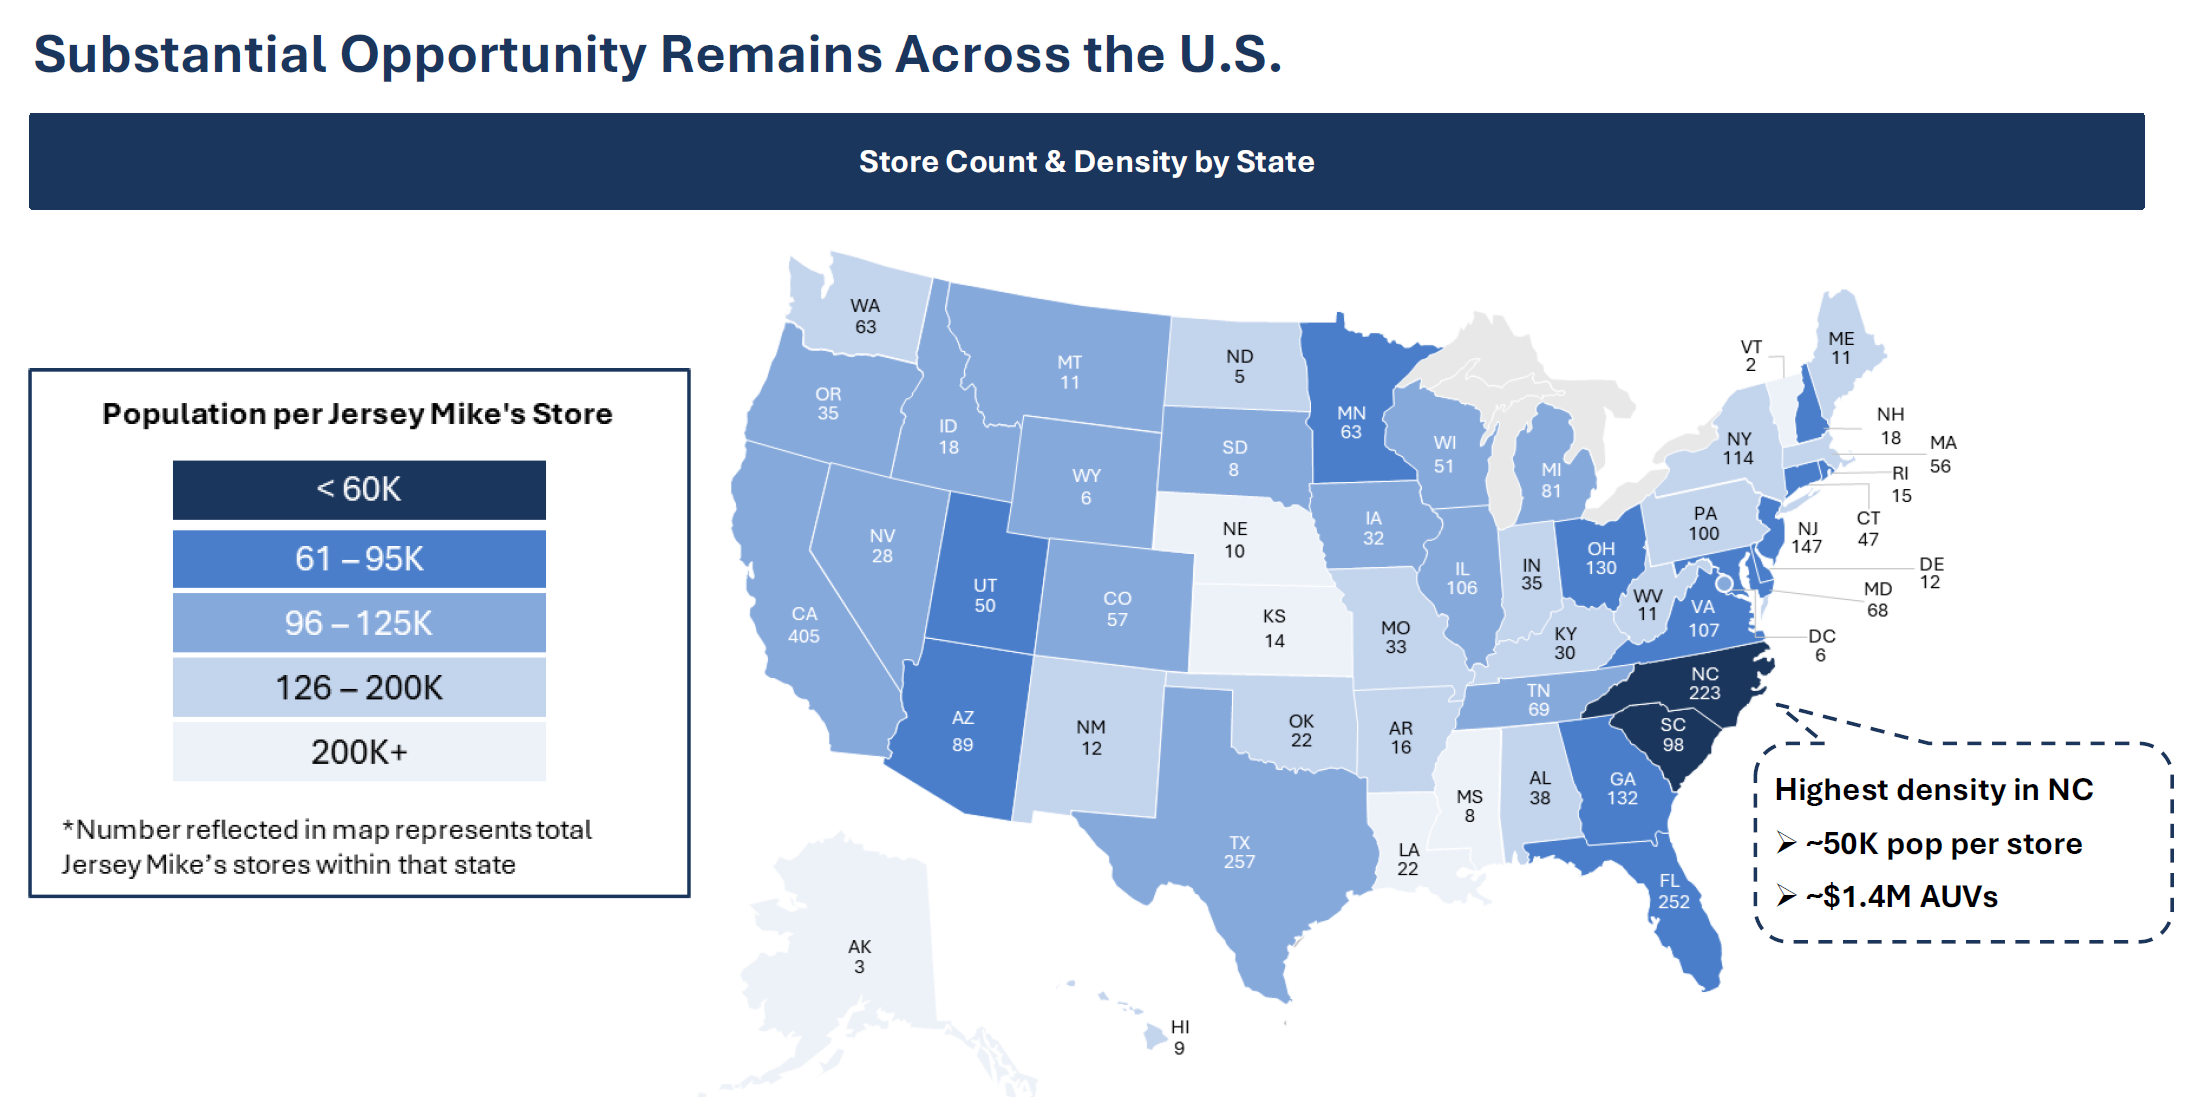 image15.png image15.png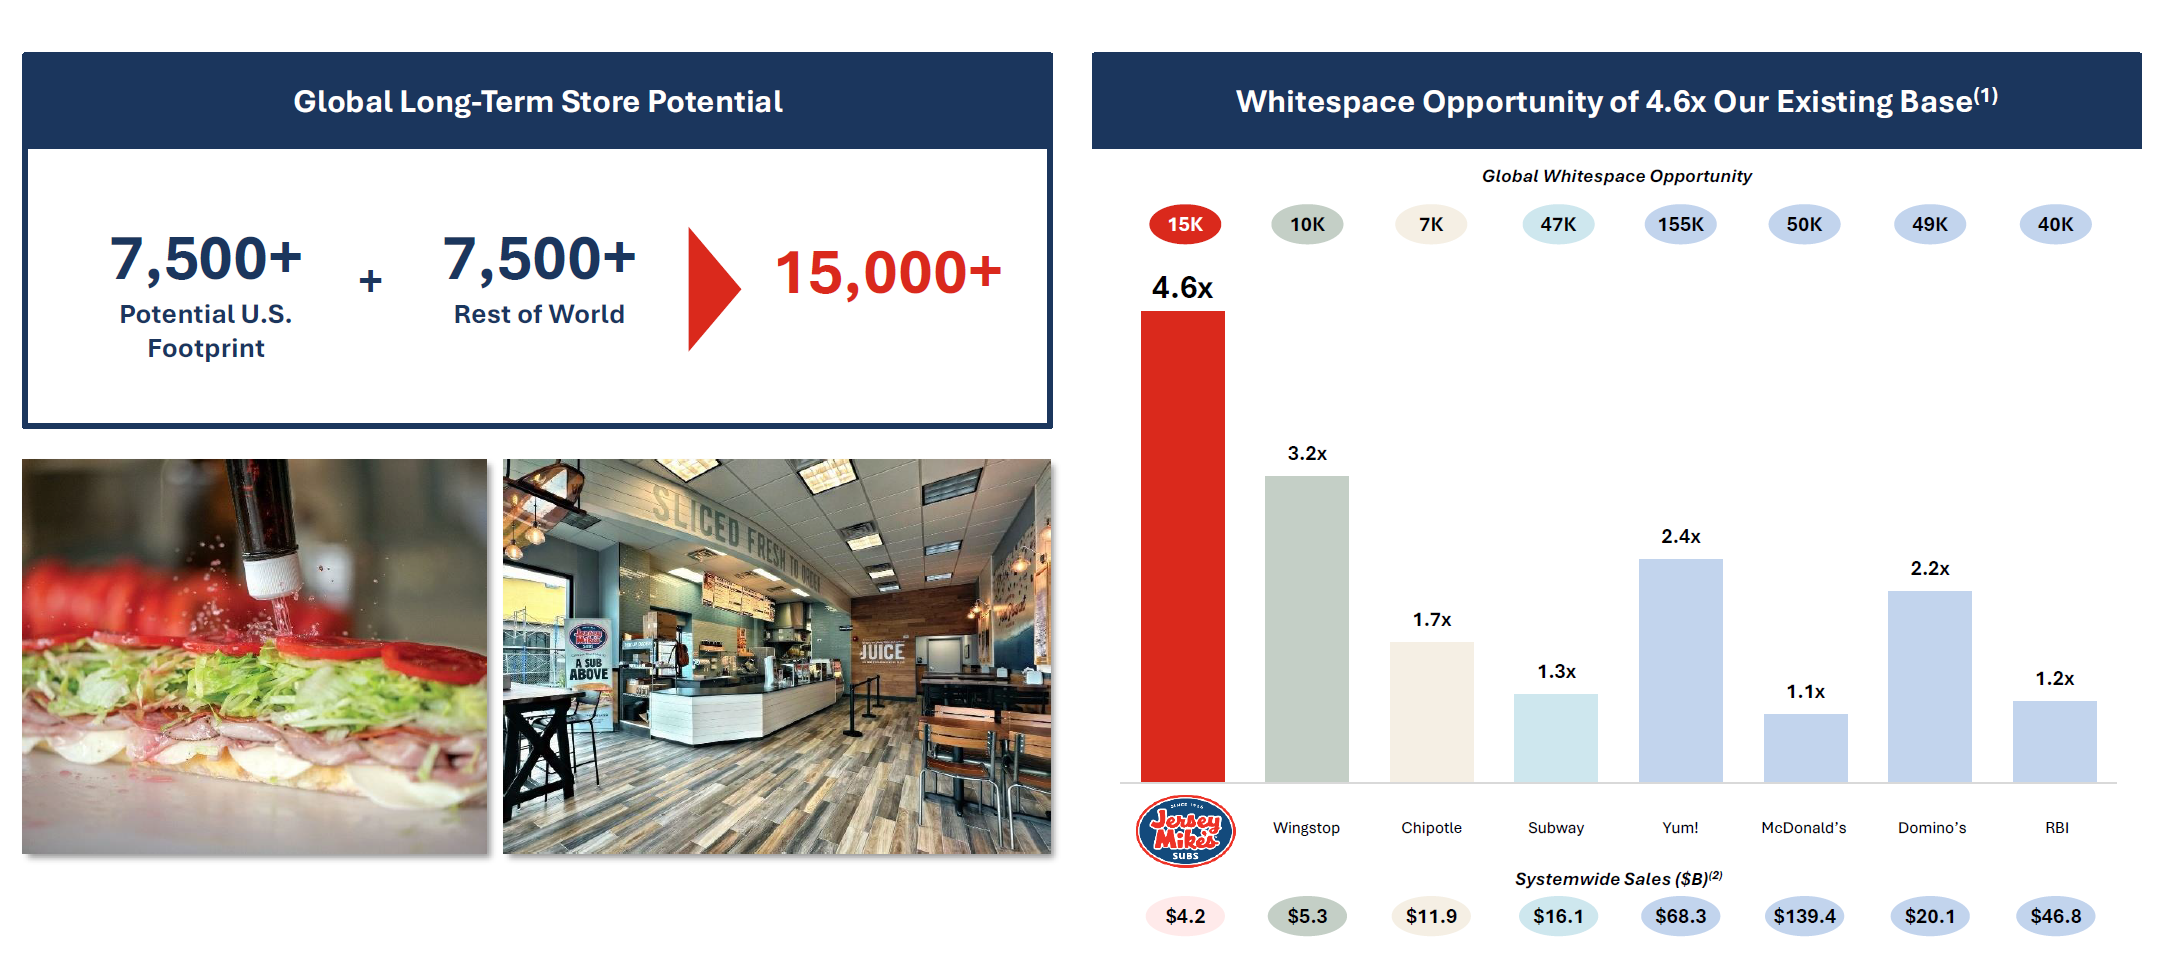 image16.png image16.png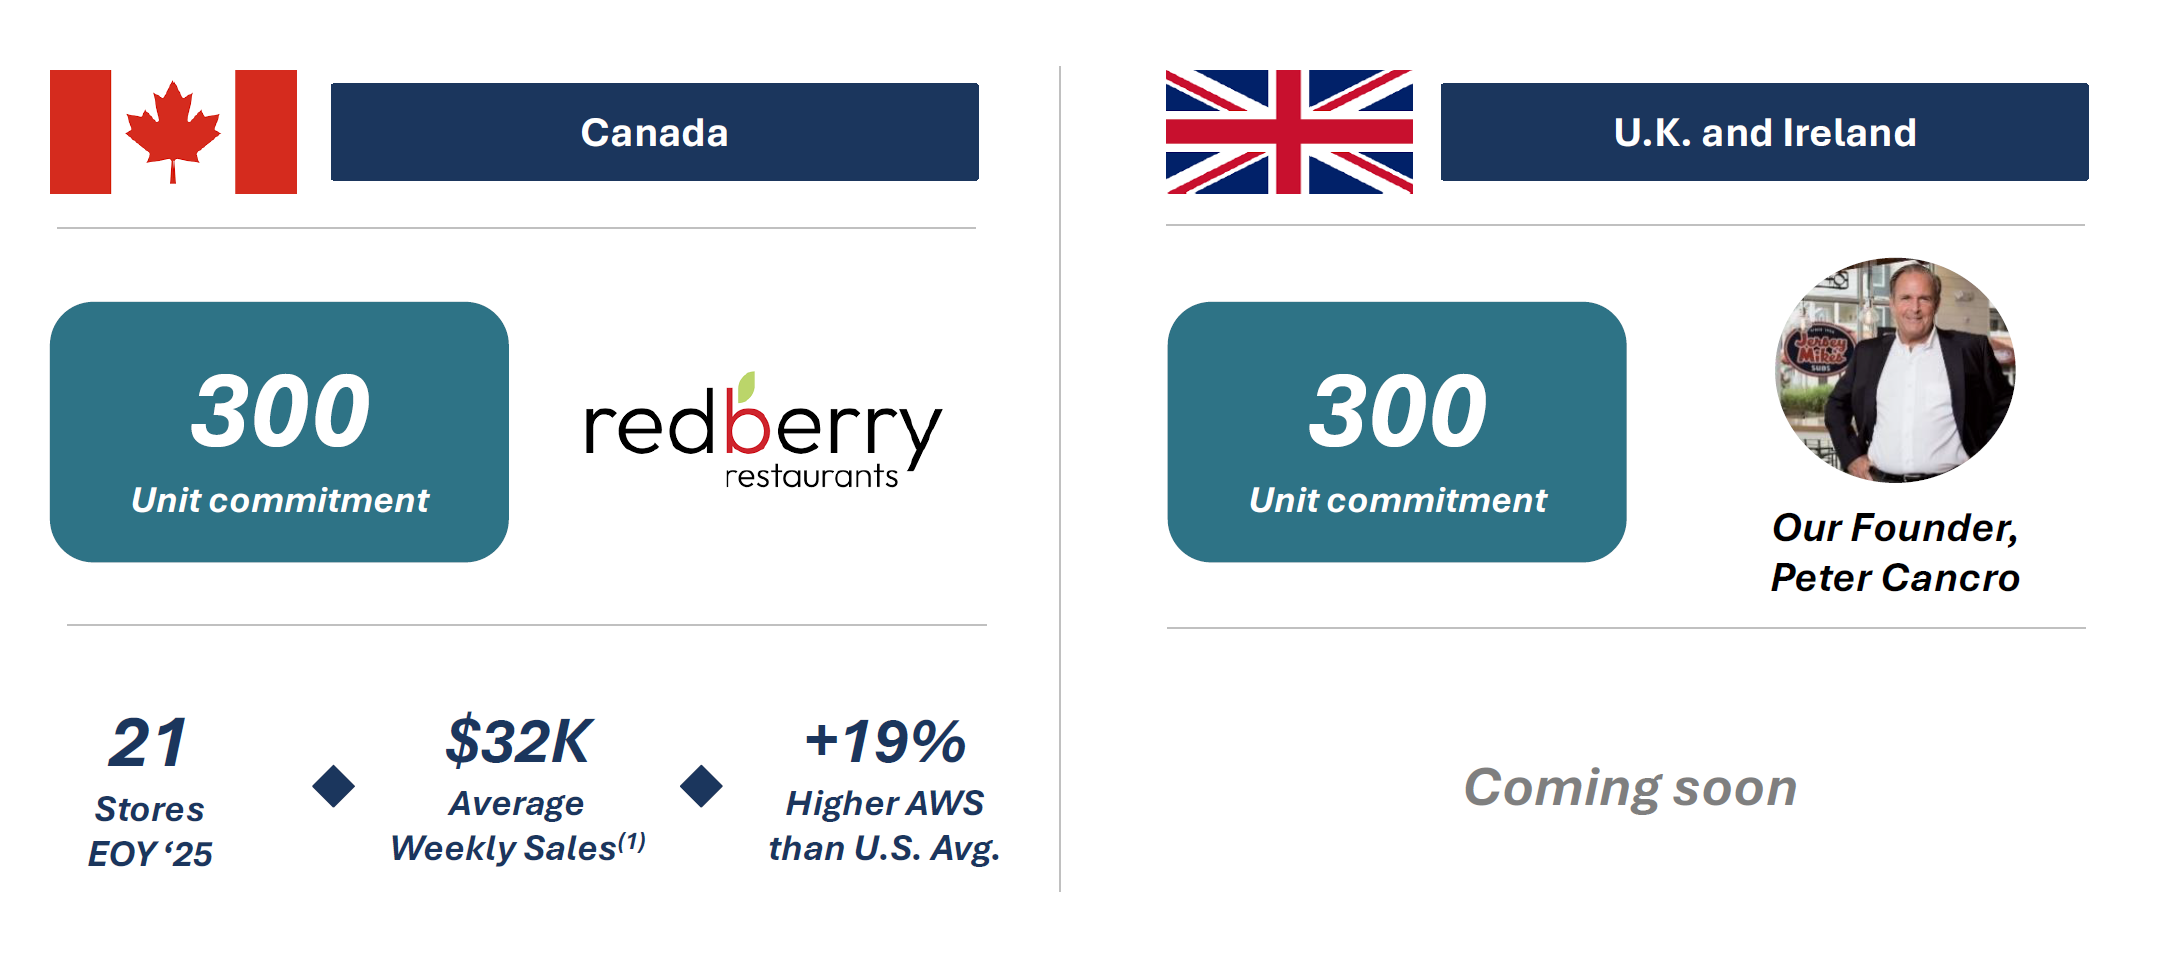 image17.png image17.png |
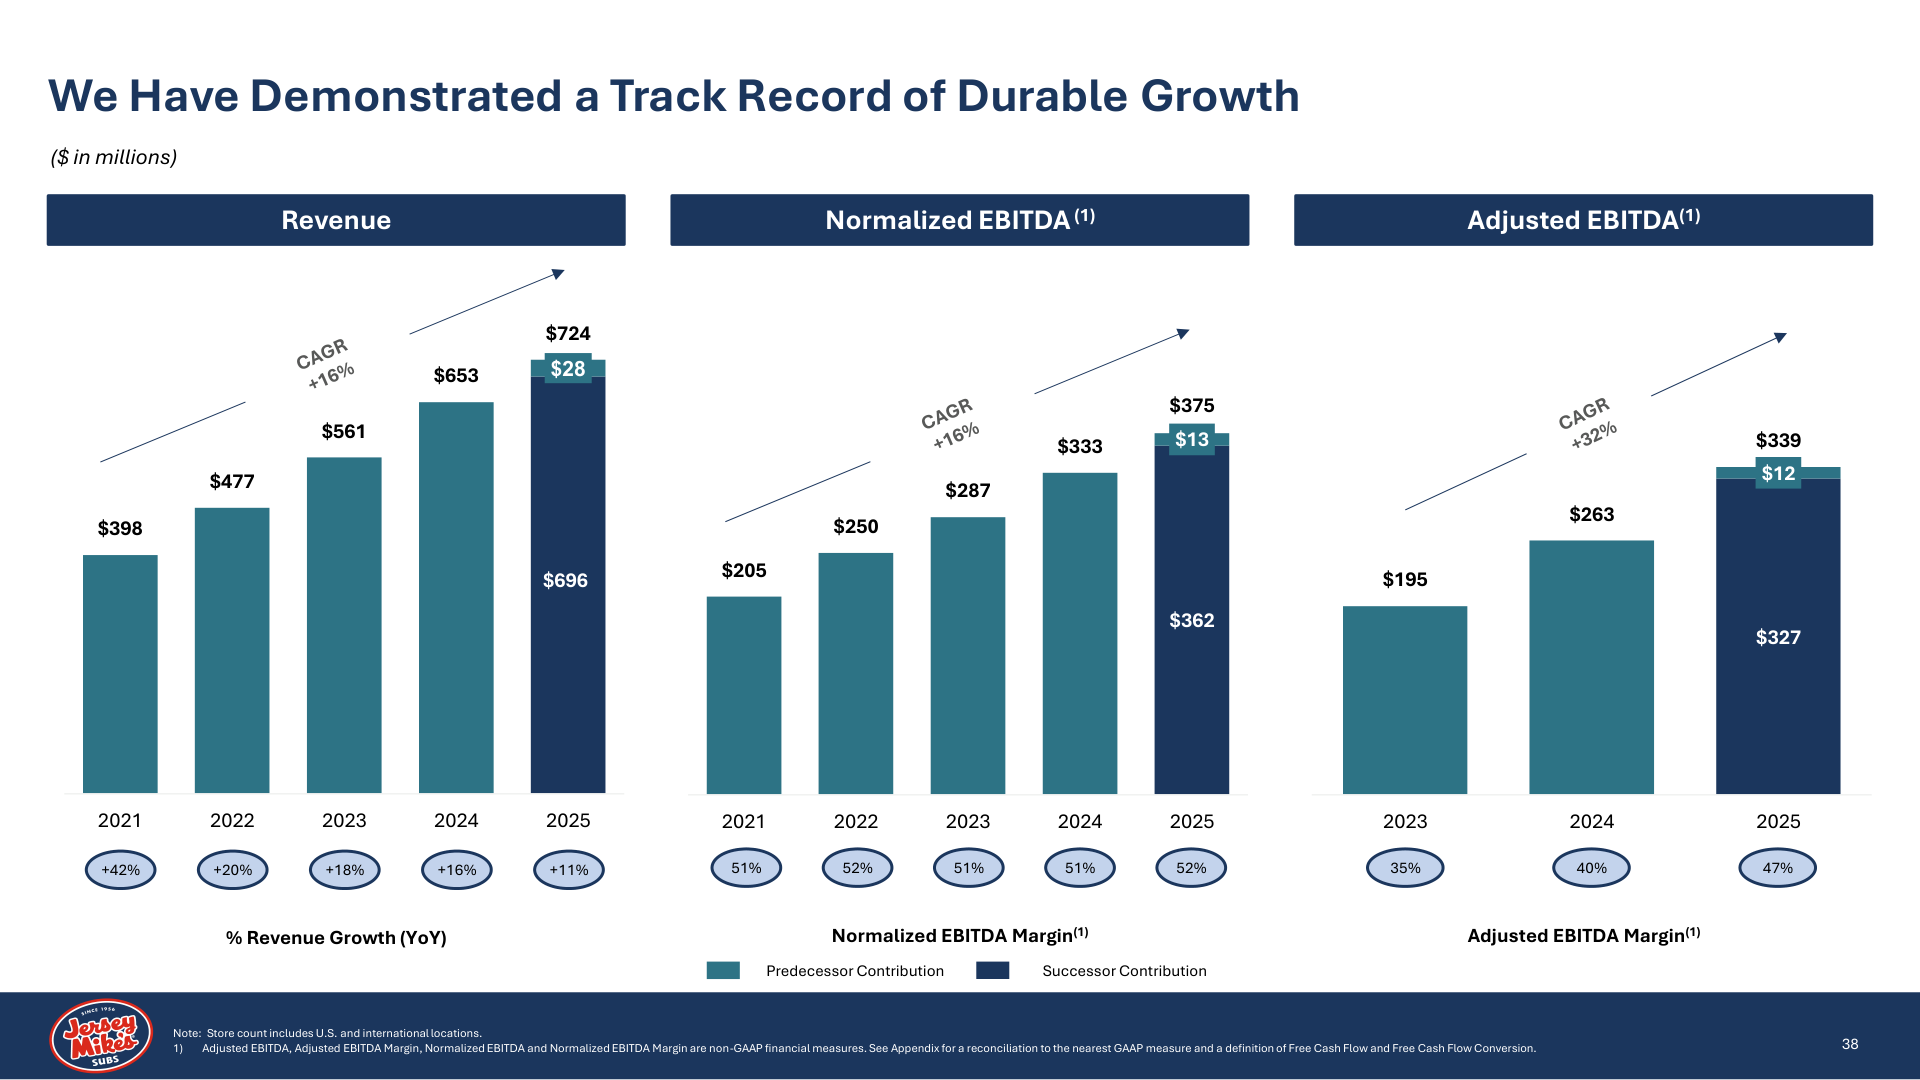
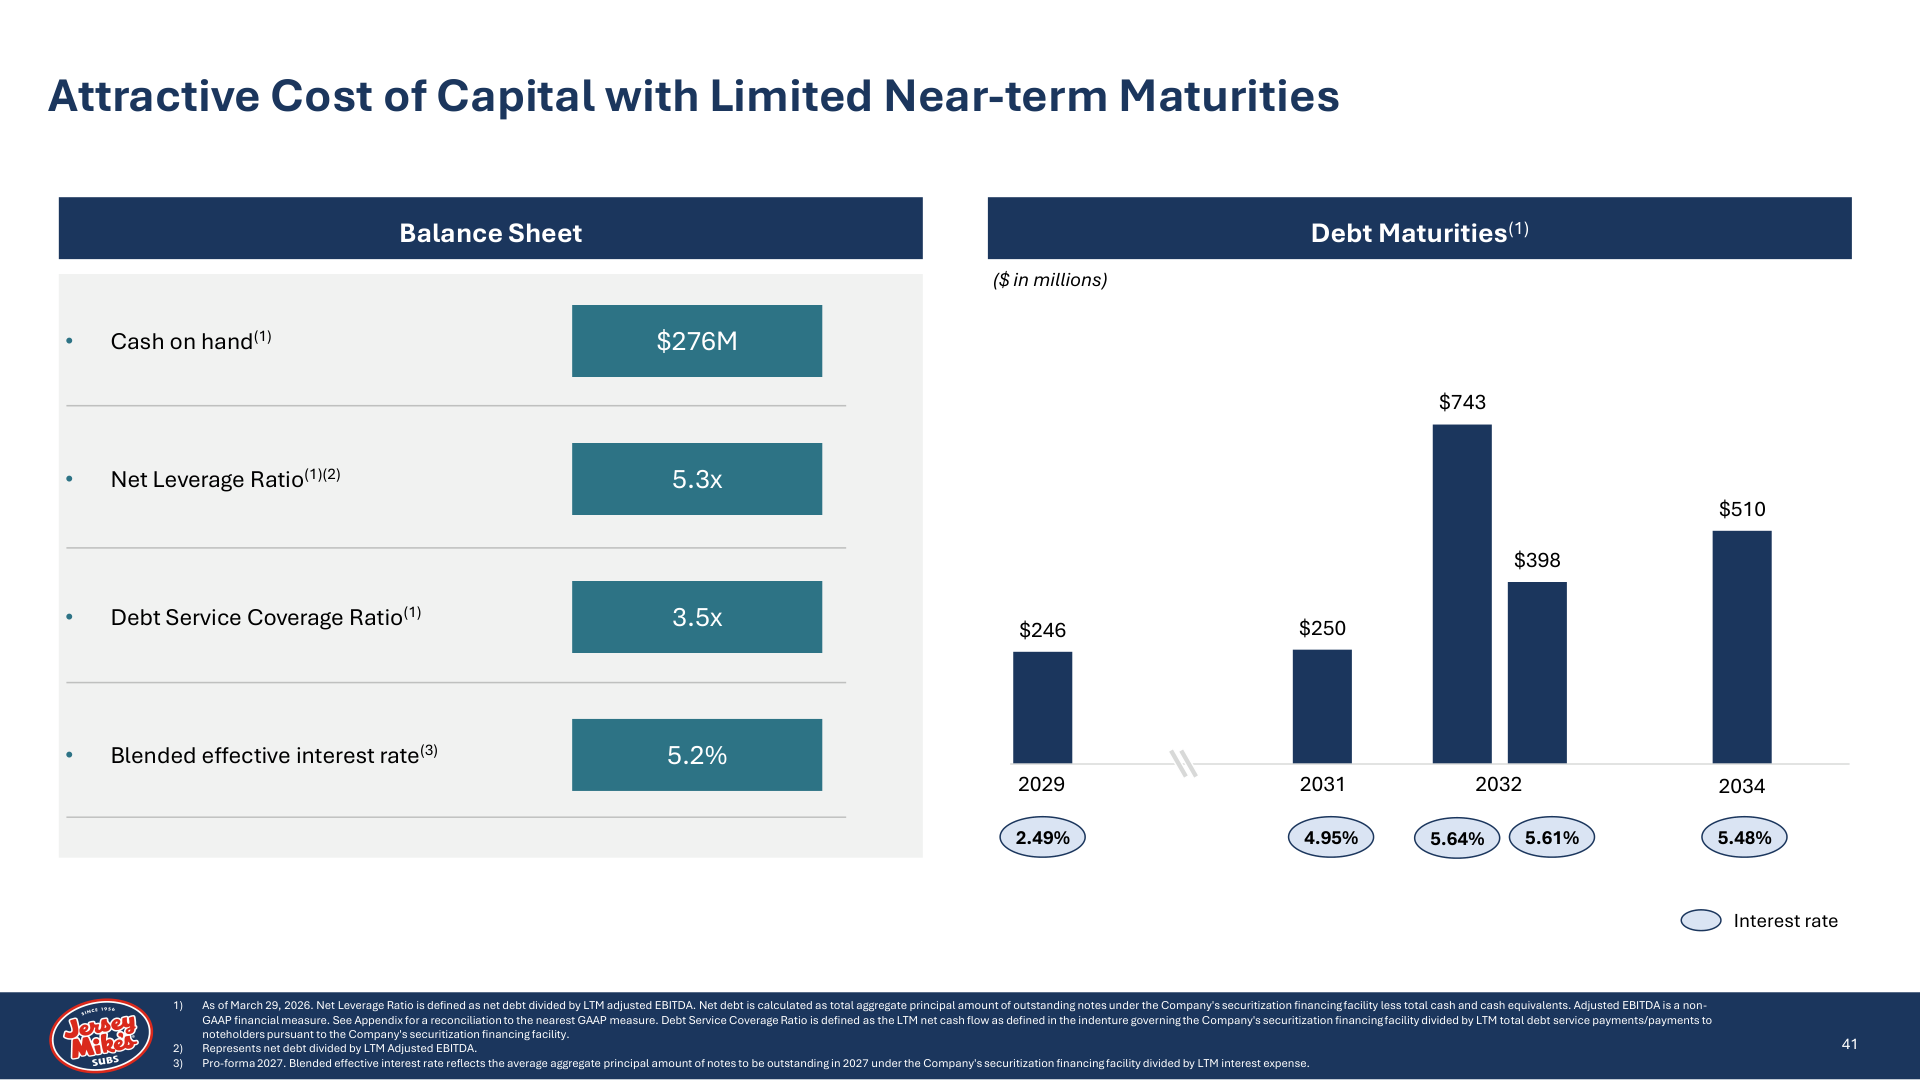
| 24 | Our Compounding Growth Model Michele Allen | INVESTMENT THESIS I’m Michele Allen, Chief Financial Officer . The investment thesis is anchored by three things: the strength of the brand, the durability of our highly attractive business model, and significant untapped growth opportunity . This business has scaled with remarkable consistency: 20 consecutive years of positive same-store sales growth , an average of 300 new store openings annually , and a development pipeline of over 1,600 stores, giving us visibility well over five years into the future . Combine that with a 99% franchised model, not only are the revenue streams highly durable but the operating margin is top of industry. And we’re not using our capital to grow the system. We have a highly predictable earnings profile with significant capacity for shareholder return. Let me bring that to life in the numbers. CONSISTENT COMPOUNDED GROWTH In the numbers, we combine low-single-digit same-store sales growth with high-single-digit predictable unit growth. That’s driven a 16% revenue CAGR over the last five years , with revenue up from roughly $400 million to more than $720 million in fiscal 2025, reflecting consistent double-digit growth every year. O ur layered, contemporary franchising model produces a 47% operating margin, second only to McDonald’s and well above other highly regarded franchised models in the industry . BEST-IN-CLASS CASH CONVERSION That margin converts to cash beautifully. Our 2025 free-cash-flow conversion was 97%, best in class across the peer set . That means n early every dollar of EBITDA we generate is converting into free cash flow. The result is a business that compounds earnings while simultaneously reducing leverage, naturally deleveraging about three-quarters of a turn annually , with a clear, consistent track record of organically deleveraging through growth. CAPITAL STRUCTURE At the end of March , we had $276 million of cash on hand and $2.1 billion of debt outstanding with a weighted-average maturity in excess of five years and a fixed 5.2% blended interest rate . Our debt-service coverage r atio was 3.5x and our leverage ratio was just over 5x. The debt structure is a whole-business securitization, and includes the ability to prepay $380 million without penalty should we choose to reduce leverage in connection with the IPO. THREE-YEAR PERFORMANCE & 2026 MOMENTUM Stepping back, the last three years reinforce why the model is so attractive. From 2023 to 2025, systemwide sales grew from approximately $3.3 billion to over $4.2 billion, up 26% over that period . Store count rose 21% to 3,256 locations and AUVs expanded to $1.36 million , supported by positive same-store sales growth in EACH year . As system sales grew, that translated efficiently into revenue growth for the company. Revenue compounded at a 14 % growth rate over the period , up from $561 million to $724 million, and normalized EBITDA grew at that same 14% CAGR. And because we require very little capital to grow, you can see strong conversion of that EBITDA into free cash flow in all three years. That momentum has carried into 2026: store count was up 8 % over the trailing twelve months and same store sales grew 1.7% in the quarter primarily driven by traffic . These combined for 11 % revenue growth LONG-TERM GROWTH ALGORITHM All of that durability rolls into a simple, repeatable algorithm: low-single-digit AUV growth plus high-single-digit unit growth, combining for low-double-digit adjusted EBITDA growth. And with high cash conversion, t he model produces significant capital for shareholder return. This is a simple, repeatable business model that is built to compound. 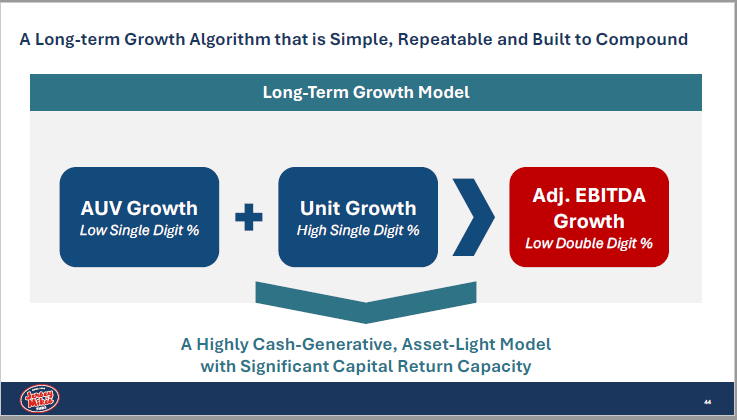 image18.png image18.png |
Growth Algorithm Slide 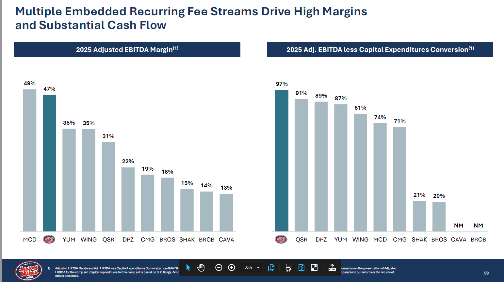 image19.pngimage18.png image19.pngimage18.png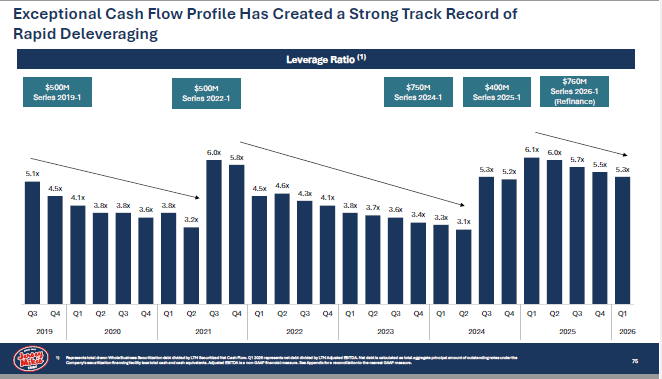 image20.png image20.png |
| 25 | Closing Remarks Charlie Morrison | To bring it home, this is a truly unique opportunity. It’s a differentiated, iconic brand with broad appeal and deep community roots. It has a foundation of predictable growth and great unit economics that keep our franchisees building. And for investors, it’s an asset-light, 99%-franchise model with high margins and excellent free-cash-flow conversion. We have a world-class team, a clear growth strategy, and a proven track record, and we’re just getting started. Thank you for your time today. We look forward to sharing this journey with you. | Recording of Charlie |
Historial completo de feedback y especificaciones técnicas compartidas por el productor Mike McBride.
Thread 1: GFX Availability This Week
For GFX 17, can we have it start a little sooner in the talk track? This will be the full bite. Lets have the graphic come on, land for a second, then 97% is highlighted like you have when mentioned.
“And that margin converts the cash at a best in class rate, which was 97% in 2025. That means nearly every dollar of EBITDA we generate is converting into free cash flow. The business has a clear and consistent track record of organically deleveraging through growth at a current rate of approximately three quarters of a turn annually.”
Going to go with V1 of GFX 18. Can you confirm that those titles are in the same font as Brendan's financial example? If not, we'll update to match. Then good to move onto GFX 19.
For GFX 19, we can stray more from the deck. Lets build the graphic against that same blue background and use the same font for titles, but feel free to dress it how you please.
Same with GFX 21. It doesn't need to match the decks look per say aside from the background and fonts and can be a bit different as long as it visually conveys the same message.
You think we can get those today? Let me know, thanks a lot!
MM
Sorry for the late hour. Here’s GFX 18 (https://f.io/3zc5fyi3).
I included three background versions for preview. Version 1 stays closest to the established style using a Jersey Mike’s blue overlay, while versions 2 and 3 use the raw b-roll with a subtle blur and dark overlay.
Once we land in a direction, I’ll send over the final alpha .mov.
Thanks, Pablo
Already uploaded GFX 17 (https://f.io/3zc5fyi3).
GFX 18 took a bit longer since I explored a couple of layout options based on the brief. I’m wrapping it up now and will send it over shortly.
Pablo
Sorry for the delay in sending these—I should have kept you posted.
Already uploaded revised GFX 7, GFX 10, and GFX 15 (+16) (https://f.io/3zc5fyi3). I included two versions of GFX 10 with slightly different animation approaches—one follows the original build more closely, while the other leans into a fuller fill animation. Let me know which direction you prefer.
I’m moving straight into GFX 17 and GFX 18 and will have those over to you by 7:00 PM ET.
Thanks, Pablo
Thank you for sending these. Please send each graphic as you finish it from here on out. That way we can get them into the cut sooner to see how they play. We'll let you know if we need to make any changes. Thank you for tackling those, I'll be on the lookout for 17 and 18 later today.
Thanks, MM
Where is the revised GFX 7? Where are GFX 10 and 15? All of these were due Tuesday EOD, and you assured me yesterday you would handle them and stick to the schedule going forward. This can't keep happening. By end of day today we need GFX 7 Revised, 10, 15, 17, 18. You're holding up the progress of the cut.
If you don't have the bandwidth to do this, please be up front and tell me now. I'll reallocate your graphics. But as of now, its Thursday and we don't have a single one that we can use in the cut from you. Please advise.
Thanks, MM
sorry for the slow response this morning and missing the ETA.
copy that. the additional beige on the “2025 Adjusted” column is the only stylistic change. it comes from the JM brand guidelines and I used it to add a bit of contrast, also added a subtle tiled background animation to give the slide some depth.
I’ll have GFX 10 and GFX 15 ready later today. would you prefer that I share them in the group thread or send them directly to you first?
you can reach me at +52 55 8262 6422 (Mexico)
thanks! pablo
We'll tackle first drafts of 17 and 18 tomorrow and 19 & 21 on Friday. Then we'll make any needed revisions this weekend and Monday. It is critical that we stay on our timeline from here on out. Can you confirm that schedule works for you going forward?
Thanks, MM
Thread 2: Jersey Mikes 30 Min GFX Thread
Stephen Roll
Producer | Director | Editor
201.674.3357 | stephenroll.com
"Let's be great today"